Posts with «arduino» label

How to make an Arduino shield with Eagle CAD – Tutorial

-->-->-->-->

There are many CAD developed to assist the electronic designers during drawing of PCBs and schematics; often they are integrated in complete suite to project, simulate and realize a whole electronic system. Besides the many commercial versions, there are also free CADs available. Today we’d like to analyze one of the most diffused and known software: Eaglecad (eagle does not mean the powerful bird but it is the acronym of Easily Applicable Graphical Layout Editor) made by Cadsoft, actually at version 6.2.0. We have chosen this one because, as you know as an Arduino’s fan, the official pcbs and schematic files of the boards are developed and available free of charge to everybody in Eaglecad format; you can find also a lot of libraries and circuits made by famous DIY website (Sparkfun for first) available for free. Eaglecad is a professional software that have gained a lot of popularity due to the Arduino’s success. One of the most important difference between Eaglecad and its competitors is the availability of a version for every of the most common desktop OS: Windows, Linux, Mac. We have to specify that Eaglecad is not Free software but is a commercial one, which can be used in the free version (eaglecad light) only for evaluation purposes and by student but you can’t use the light version in any case when you earn or save money by using it. For further details about licenses and distributors have a look to the official Eaglecad website where you can find all the information you need. Remember that the light version has some limitations; anyway you can design circuit with a discrete complexity, as the one you can see at http://elmicro.com/en/kit12.html. The limitations are:

 - pcb dimensions not bigger than 100×80 mm;

 - no more than 2 layers;

 - only 1 sheet for schematic.

Now let’s have a look at the software itself starting from the GUI, which is made by three main units:

Control Panel

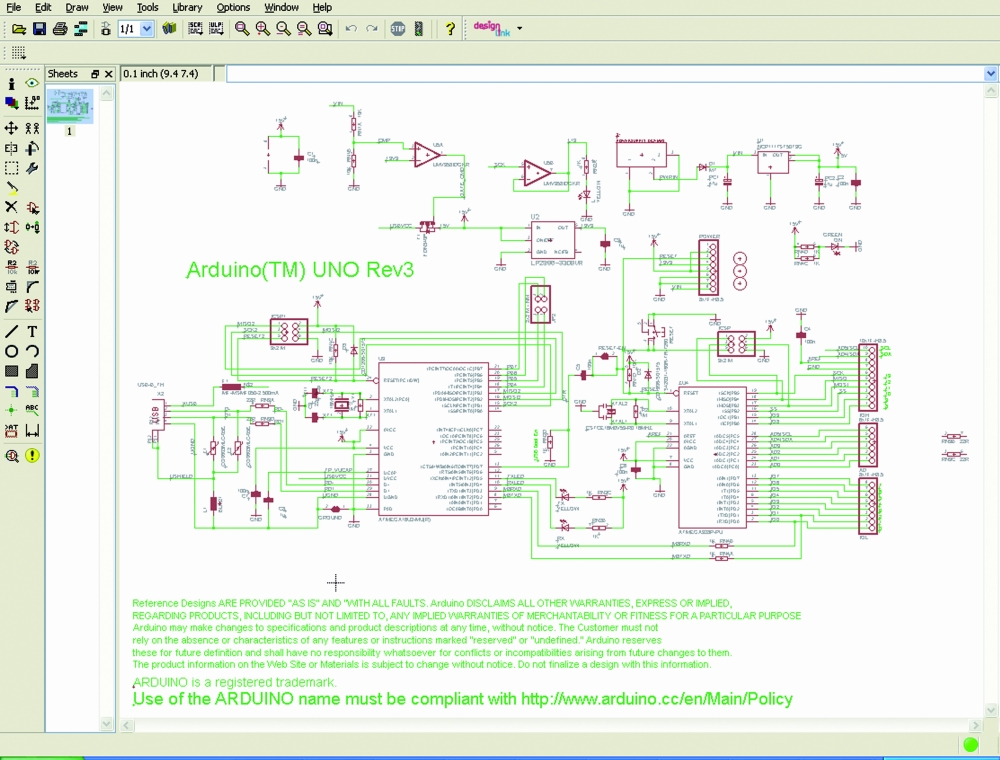
Schematic (you can see an Arduino’s UNO R3 board schematic screenshot)

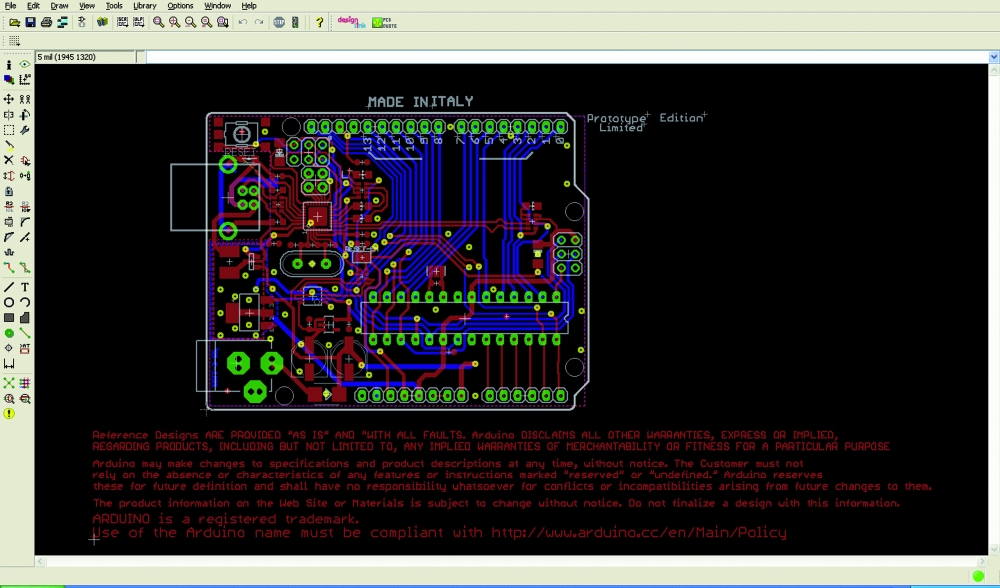
Board (the pcb editor) which can be seen “in action” which shows the pcb of the Arduino’s R3 board


For people used to the other similar cads, the interface is very closed to them and you’ll learn to use it easily; anyway to use the most powerful functions you need some practice.

The first thing you see at the CAD start up is the Control Panel, from which you can easily get access (for example) to the libraries, projects and examples; this is the software section where you can configure the main options like user’s folders, delay for the autosave option and the most important graphical parameters, all by getting access to the “OPTIONS” menu. The available documentation is pretty complete: you can access to the help function from the “help” menu available in both “Schematic” and “Pcb”. If you need further details you have to read the complete manual and the tutorial which are both available getting access to “Start” (on Windows), Programs-> Eagle Layout Editor 6.2.0.

Let’s try to have practice with an example: we want to draw an Arduino’s shield made by 4 leds e da 4 switches, connected to 8 digital pins; it’s obvious due to the kind of circuit we are approaching to make, that this shield is only for training purposes. This pcb can be used to show the digital logic level of one or some pins, levels that could be changed by the four switches or to have a led alarm in case of an analog becomes higher or lower than some level.

For first we have to draw the schematic so we select “FILE”, “NEW”, “SCHEMATIC” in this order: the Schematic window will open up. It is mainly made by two groups of icons: one on the top with the main commands like file management and zoom and another one on the left with the “drawing” icons.


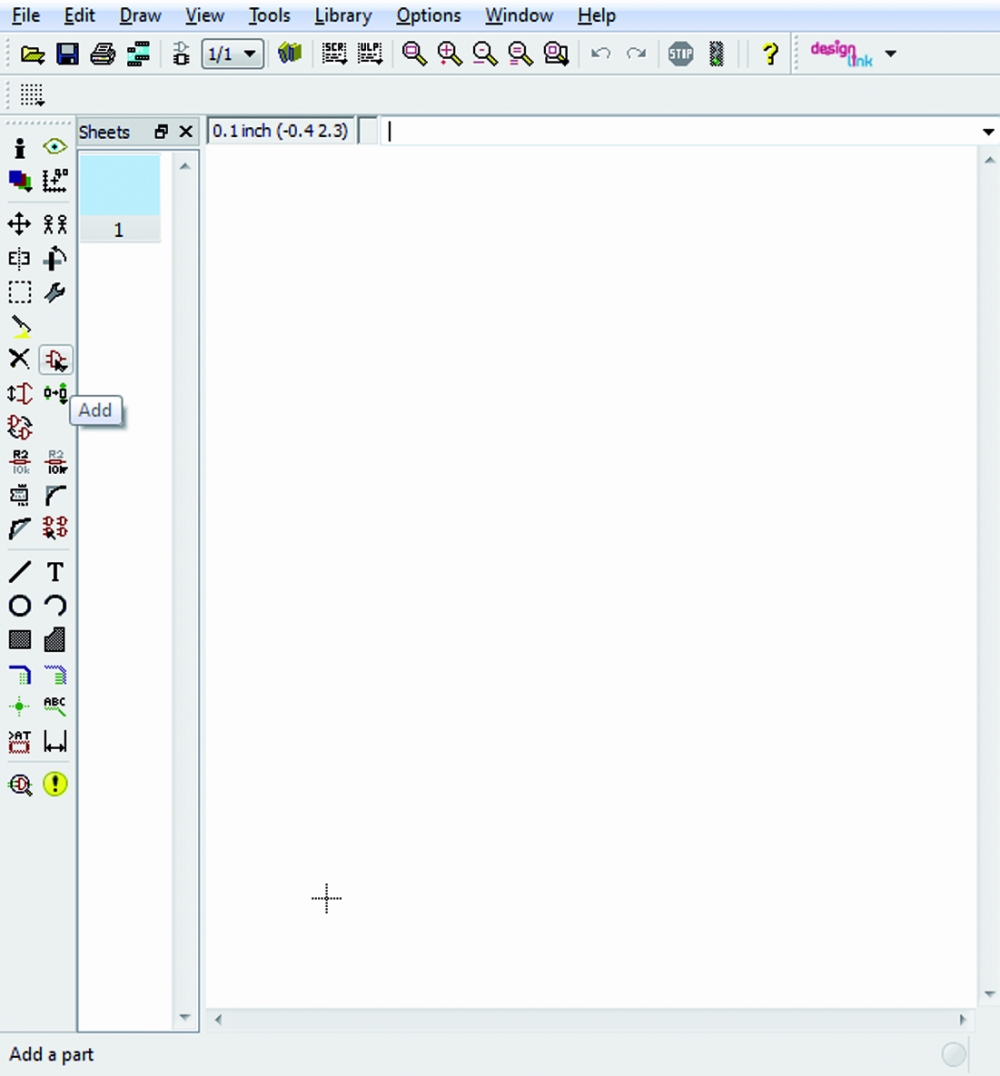
We can add the components by selecting the “AND” gate icon on the left hand side of the screen; when the cursor will be on it the word “Add” will pop up. Once selected, a list of libraries will be shown.

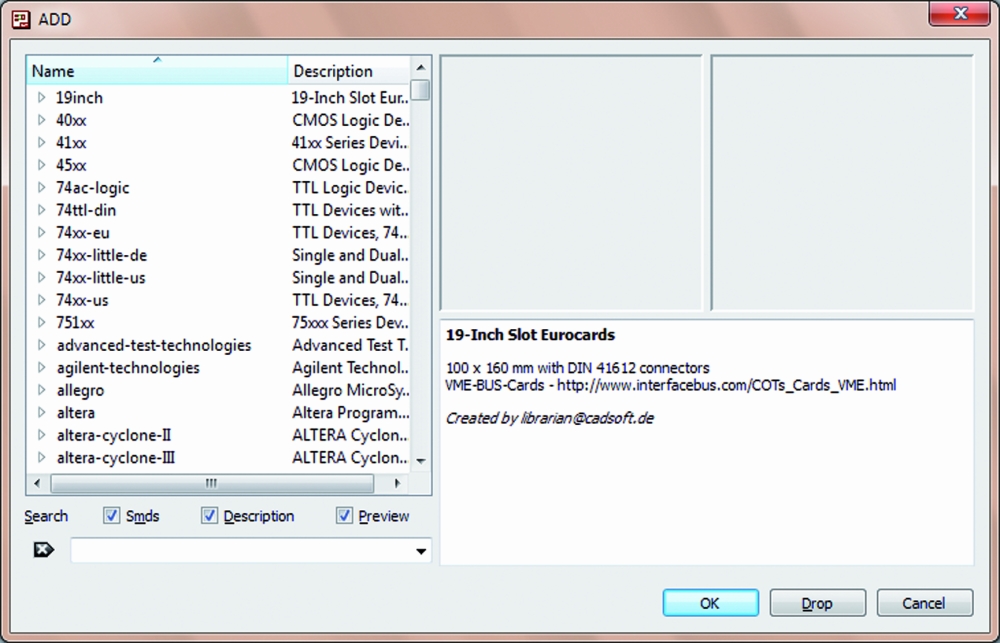
We can add other libraries like the Sparkfun one for example or we can also modify the ones which are provided by Eaglecad. Now select “Resistor”, “R-EU”: on the screen will appear a sub library where we can choose the kind of resistor we need (SMD,trough-hole) and its package.

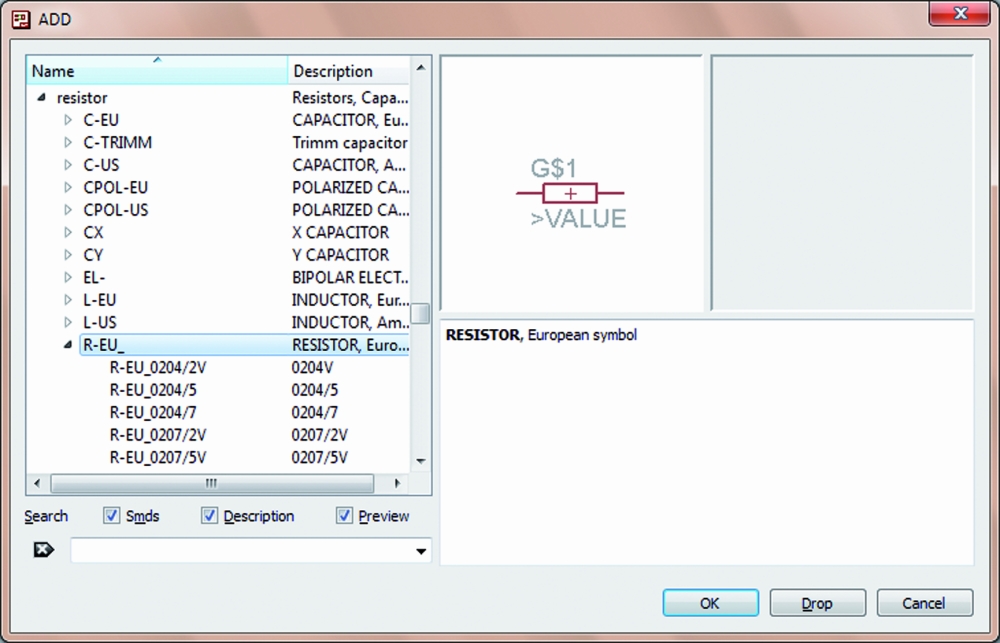
For our example we’d like to use trough hole components so we’ll choose “R-EU_02_07/10″ which is a 1/4W resistor horizontally mounted. Once a component has been chosen, on the right hand side of the window, Eaglecad shows the component symbol used in the schematic and beside the pcb pads of such component and the space required on the PCB. There is another window under the two we have seen before where there are details and notes that have been inserted during creation of the selected component.

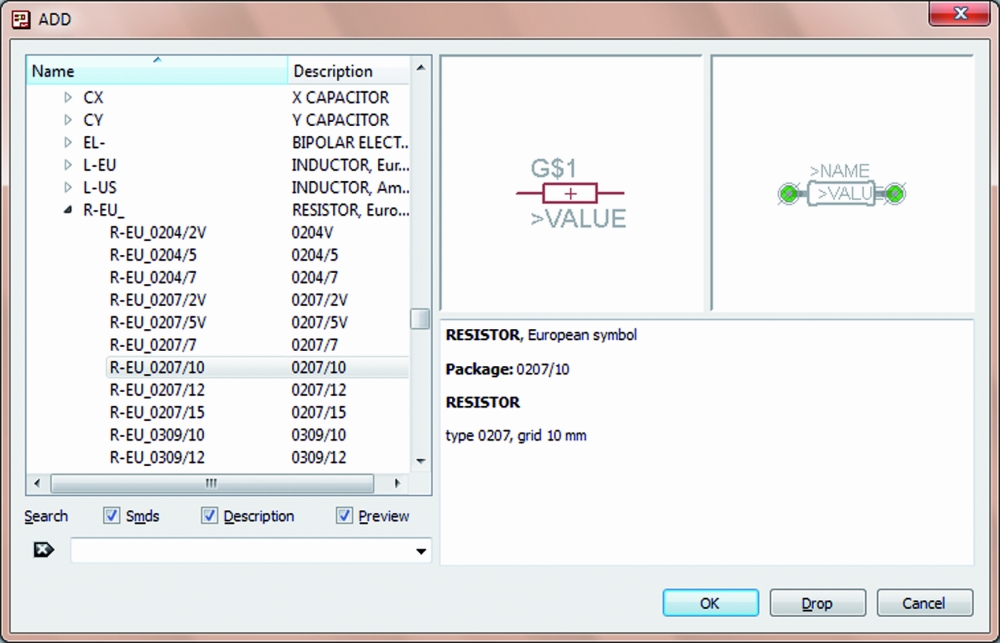
We need 4 of such components so we click on “OK”, move on the schematic drawing area and put the element where we want by clicking again. Eaglecad automatically names resistors in a progressive way.

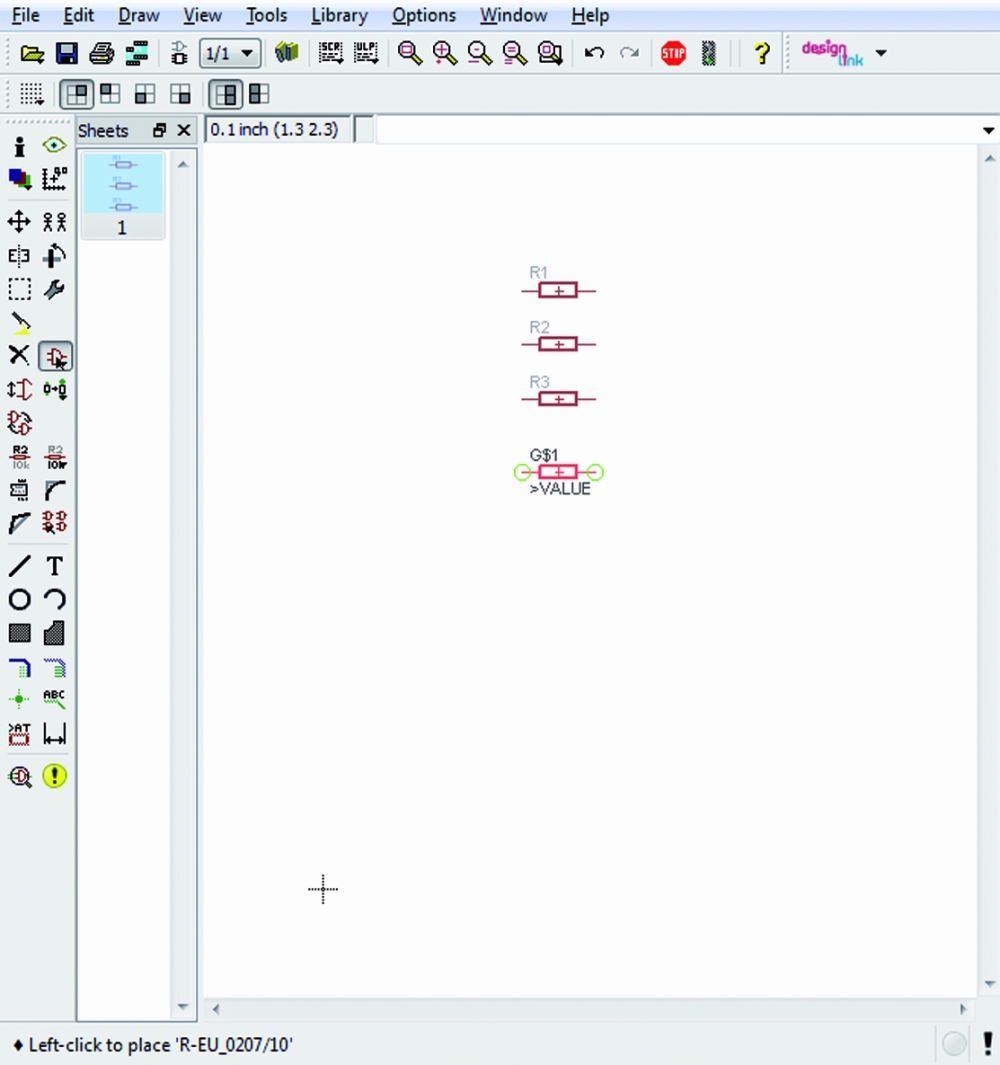
When we have finished with these components, we have to select “ESC” on the keyboard: again the “ADD” window will open itself; now we select “LED5MM” in the “LED” sub-library which is contained into the “Led” library and we’ll draw four leds as done before.

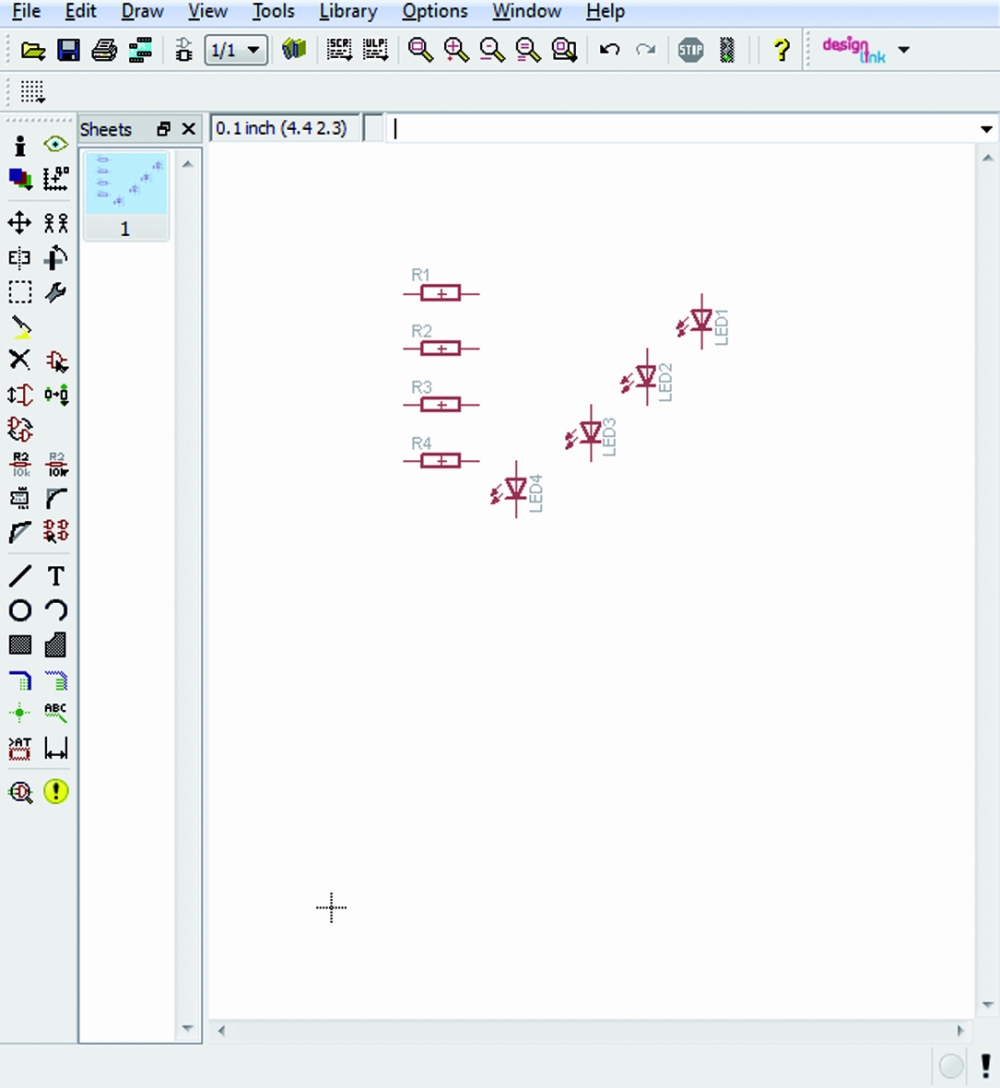
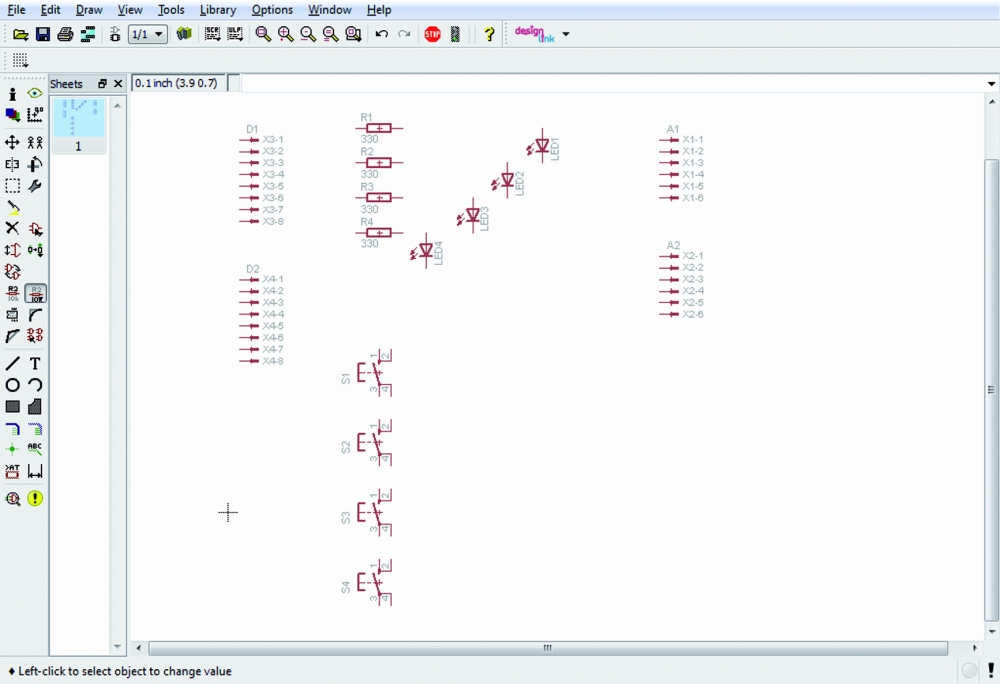
In the same way we can select the 4 switches “10-xx” available in the library “switch-omron”; these actions lead us to the situation shown here:

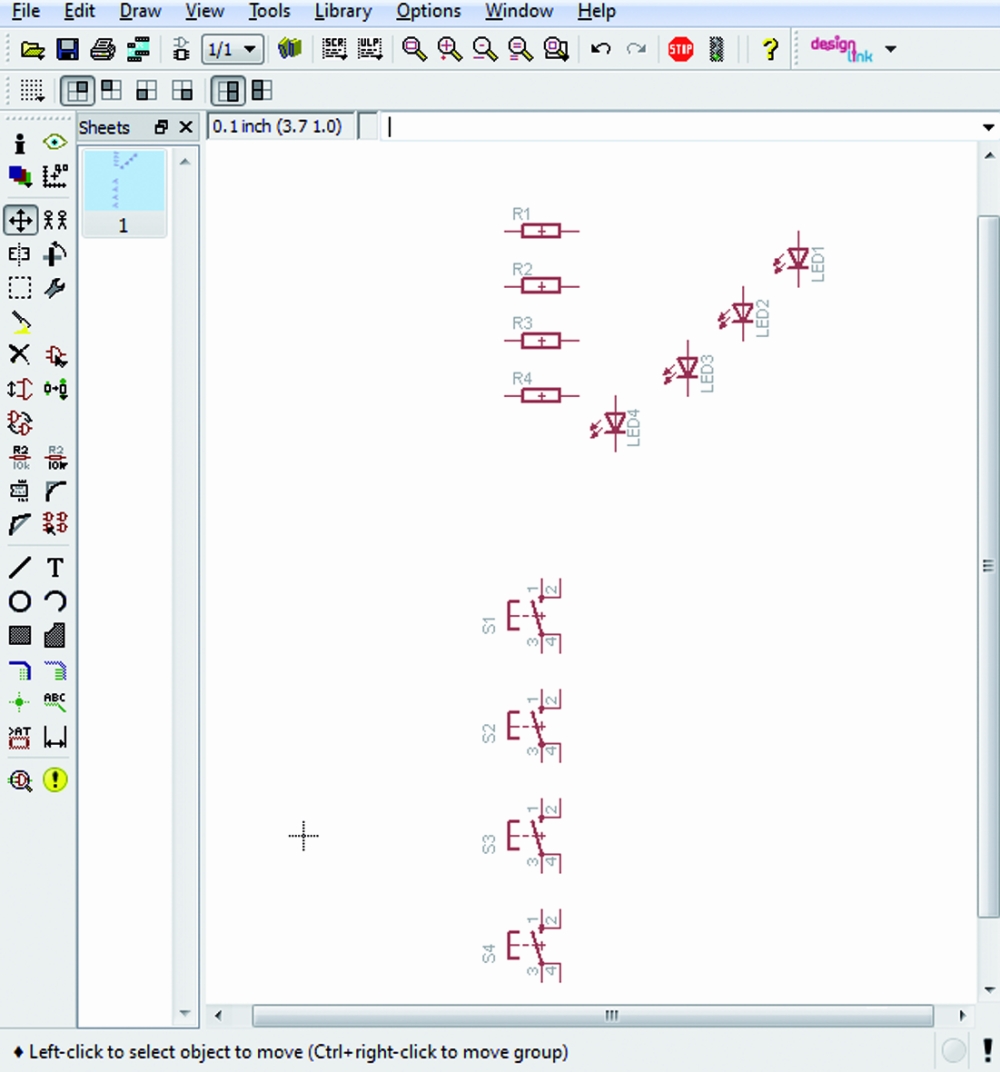
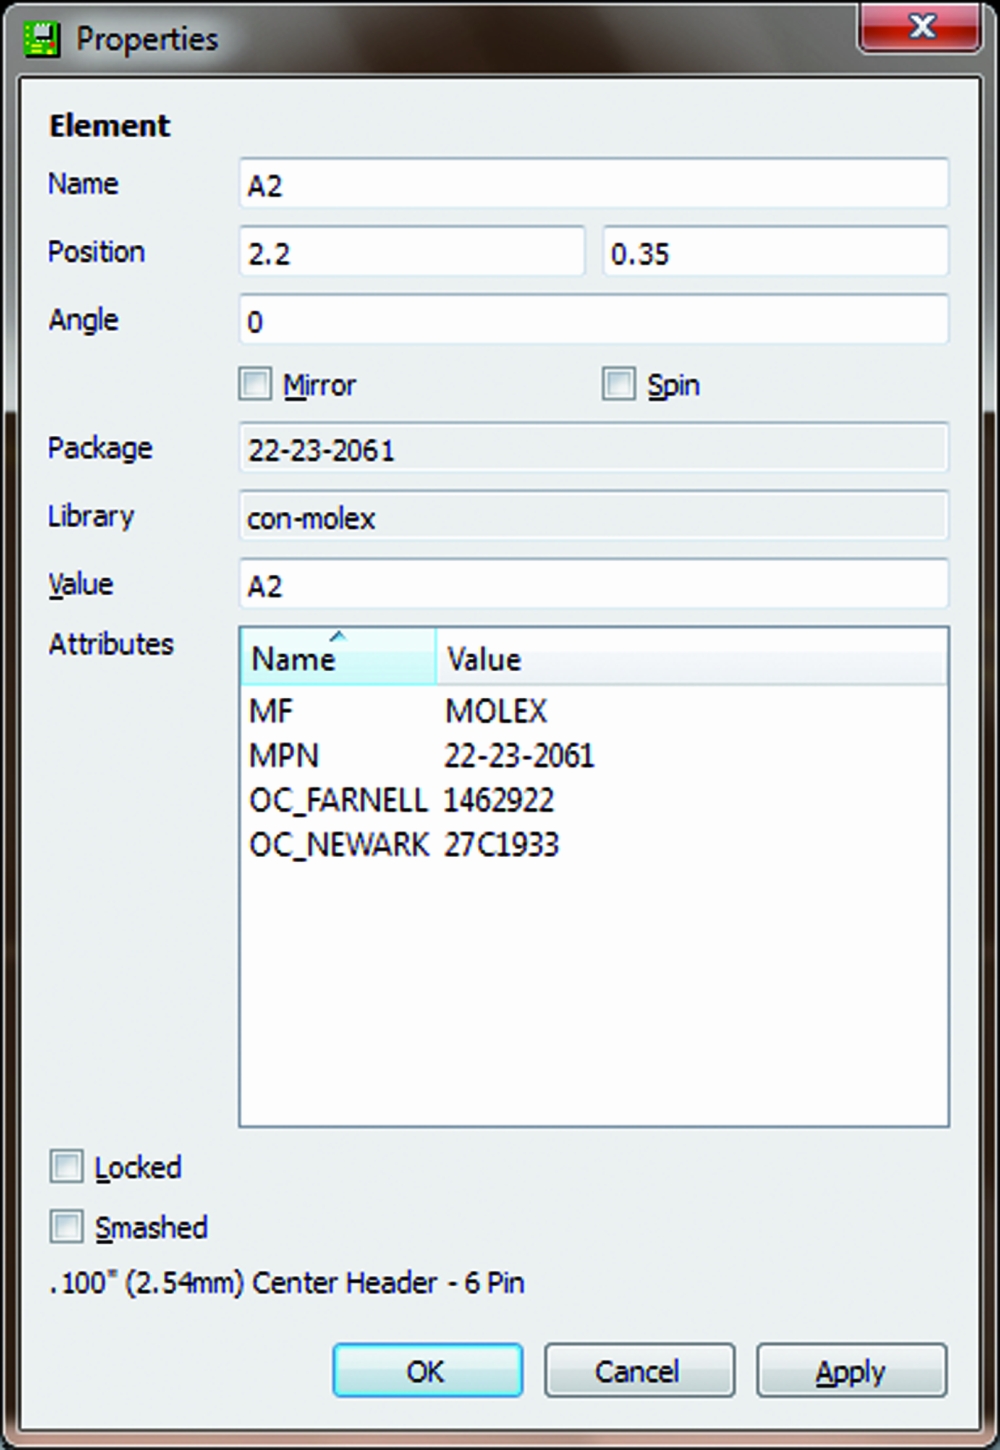
For the moment we can mainly focus our attention about the correct type of the connectors so we add, as explained before, two made by 6 contacts for the power supply section and the analog connections and other two made by 8 pins for digitals; the chosen connectors are the ones in the “con-molex” library, identified by “22-23-2061″ e “22-23-2081″. Push two times ESC to exit and so far we are in the conditions show:

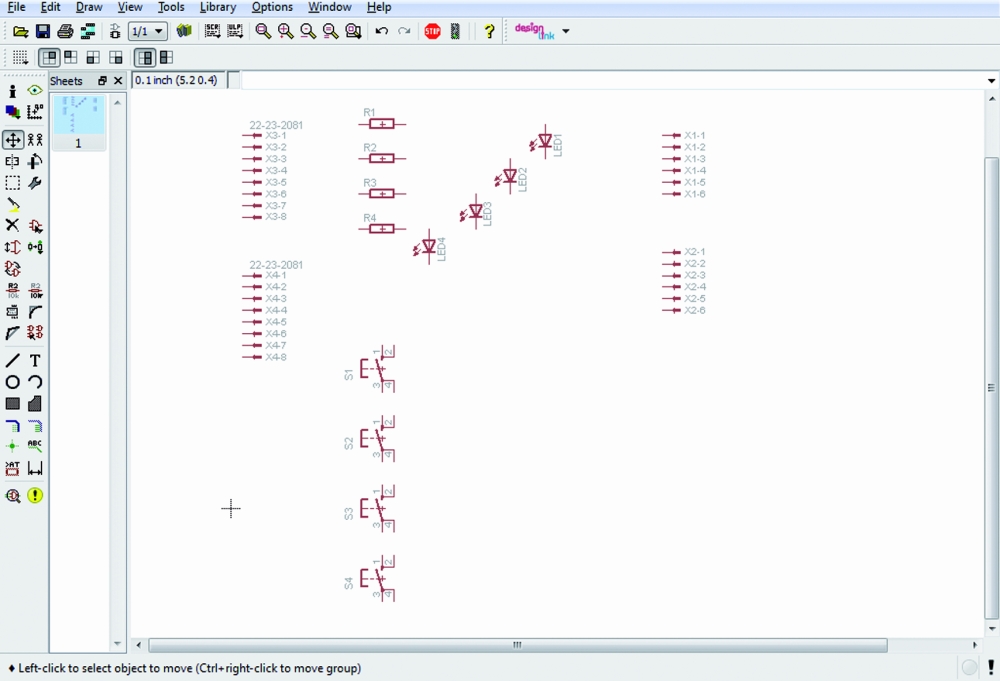
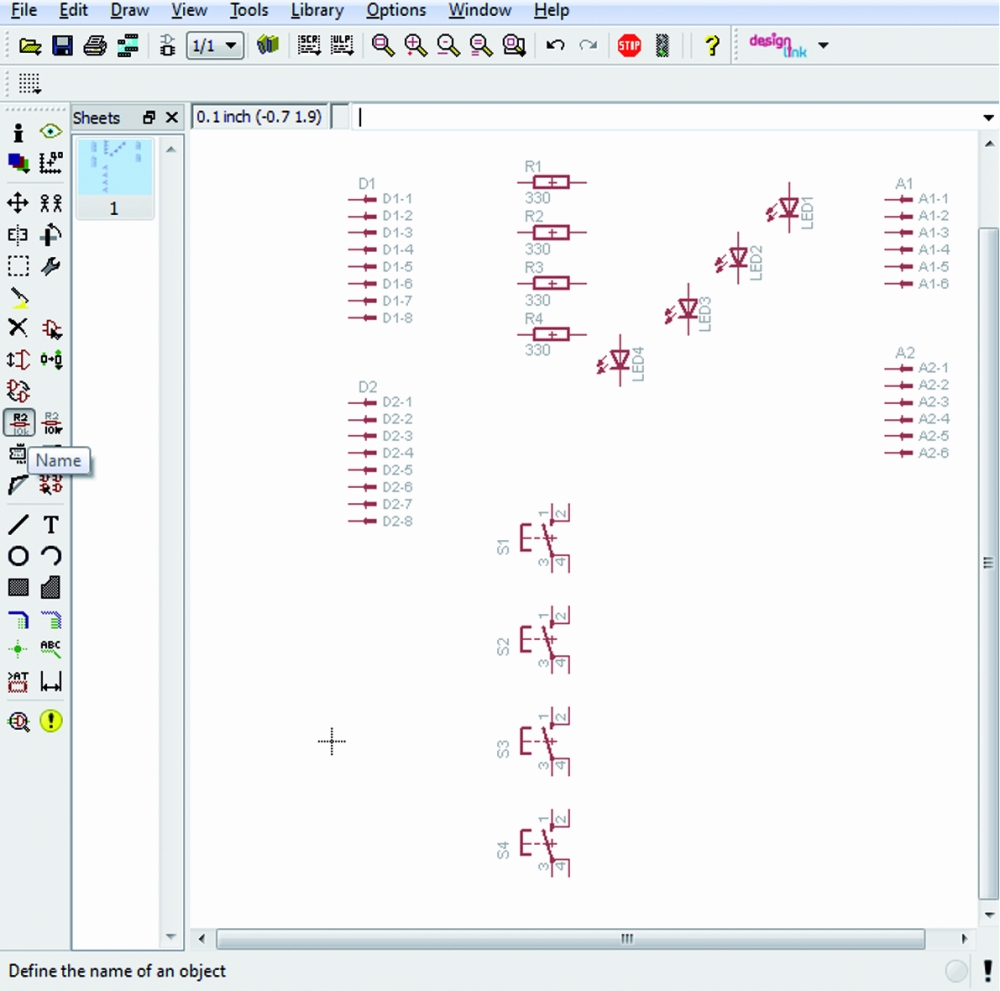
Now select the 4 resistors one at time, right-click and select “Value” in order to assign the desired value to each of them. Do the same with the 4 connectors, in order to change their value e.g. into A1, A2, D1, D2. A warning window with two choices will pop up: we’ll chose “Yes” and in the next window we’ll insert the required value. We’ll do the same for the next three strips.

Now below every resistors there is the resistance value and also the four connectors have been renamed as required. It is also possible to rename every singol contact of every connector. Let’s do that, in order to avoid mistakes: select “name” in the left hand column and then put the mouse cursor on every contact to replace their name, e.g. “D1″, “D2″, “A1″, “A2″.

In this way it is easy to understand for every contact which is the related connector strip. Now insert the ground symbol and connect the LED cathodes to them (Eaglecad have available many kind of ground symbols: they are in the libraries “supply1″ and “supply2″). We’ll choose “GND” available in the “supply1″ library. Looking at the digital strips we can notice that they are in the “wrong” side of the schematic. To have a more easily access to the contact connections and to have a clear and readable schematic, we can use the”mirror” command to mirror the selected parts. Before apply this command, select the symbols of both connectors with the command “group” in order to reduce the number of required actions.

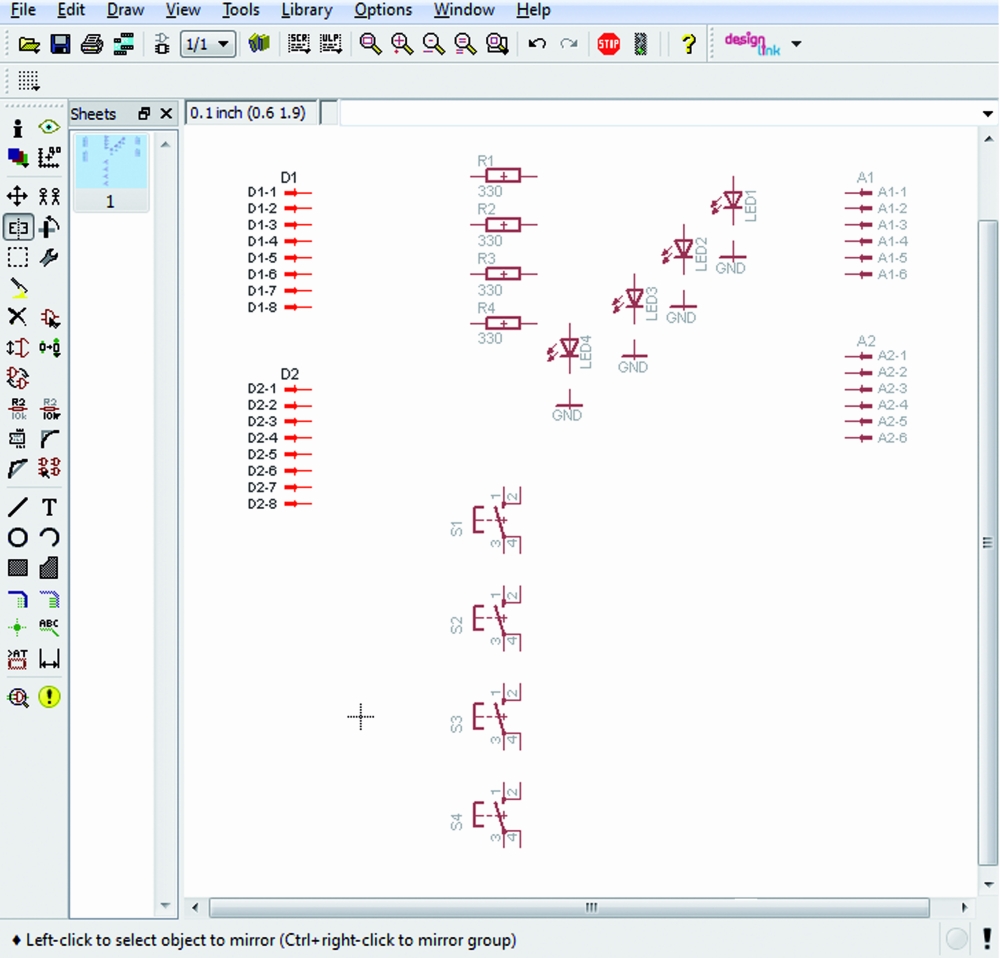
Select “Mirror” and then put the mouse pointer on the working area and select by left clicking first and then by right clicking “Mirror: Group”. Now it’ s time to draw connections. We can proceed in two ways: by selecting the commands “Draw” and “Wire” in sequence or by clicking with the left mouse switch on the related icon. To connect components put the cursor on the end of the symbol you want to connect, click with the left mouse switch and move the pointer on the terminal of the other components you have to connect to and click again.

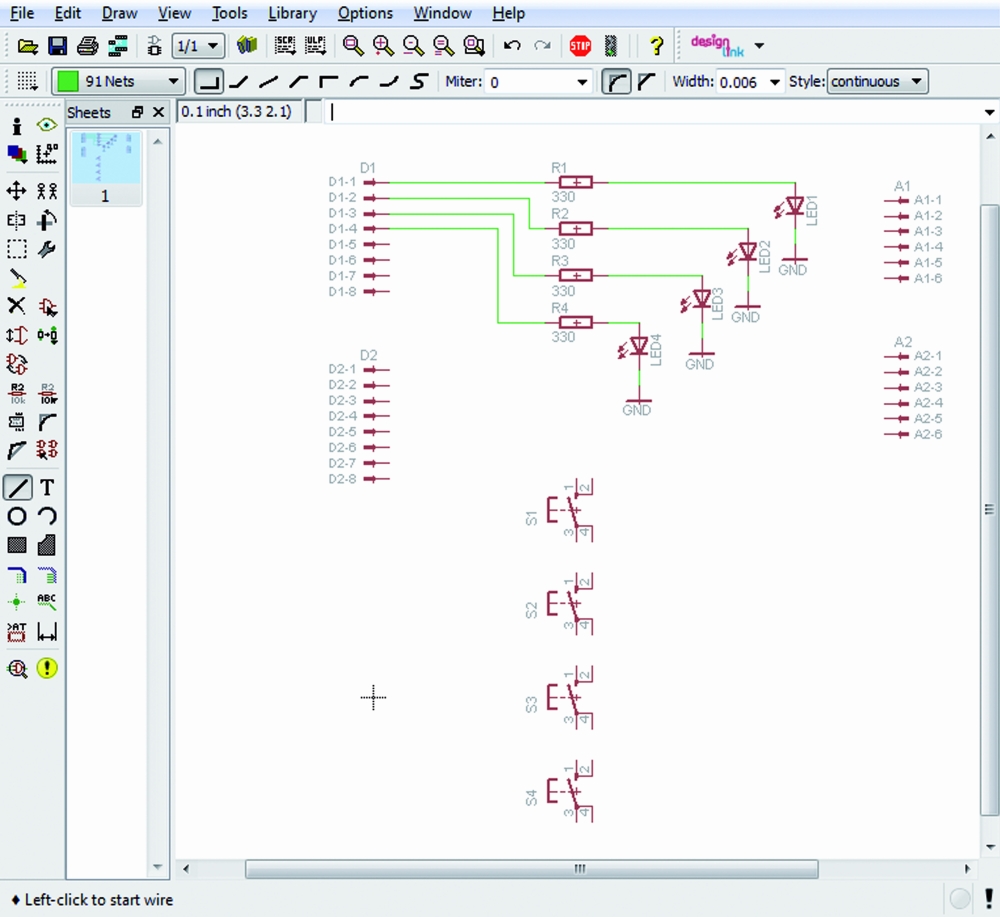
To go to the next connection push ESC on the keyboard, put the mouse pointer where you want to draw the next wire and then left click again.

So far so good. We have focused our attention on LEDs, forgetting the switches. Never mind, we can insert, modify, delete, change the inserted parts in the schematic every time we need it; now we insert the missing components adding the required connections.

As you can see it’s easy to rotate and to move any part by using the related function in the “edit” menu or by selecting the desired icon in the left hand side column.

Once all the connections are done, select “Tool”, “Erc” to solve errors, if any, which will be shown in the “Erc errors” window where Eaglecad lists some issues: leds and switches have no value and the pins of the strips are not connected.

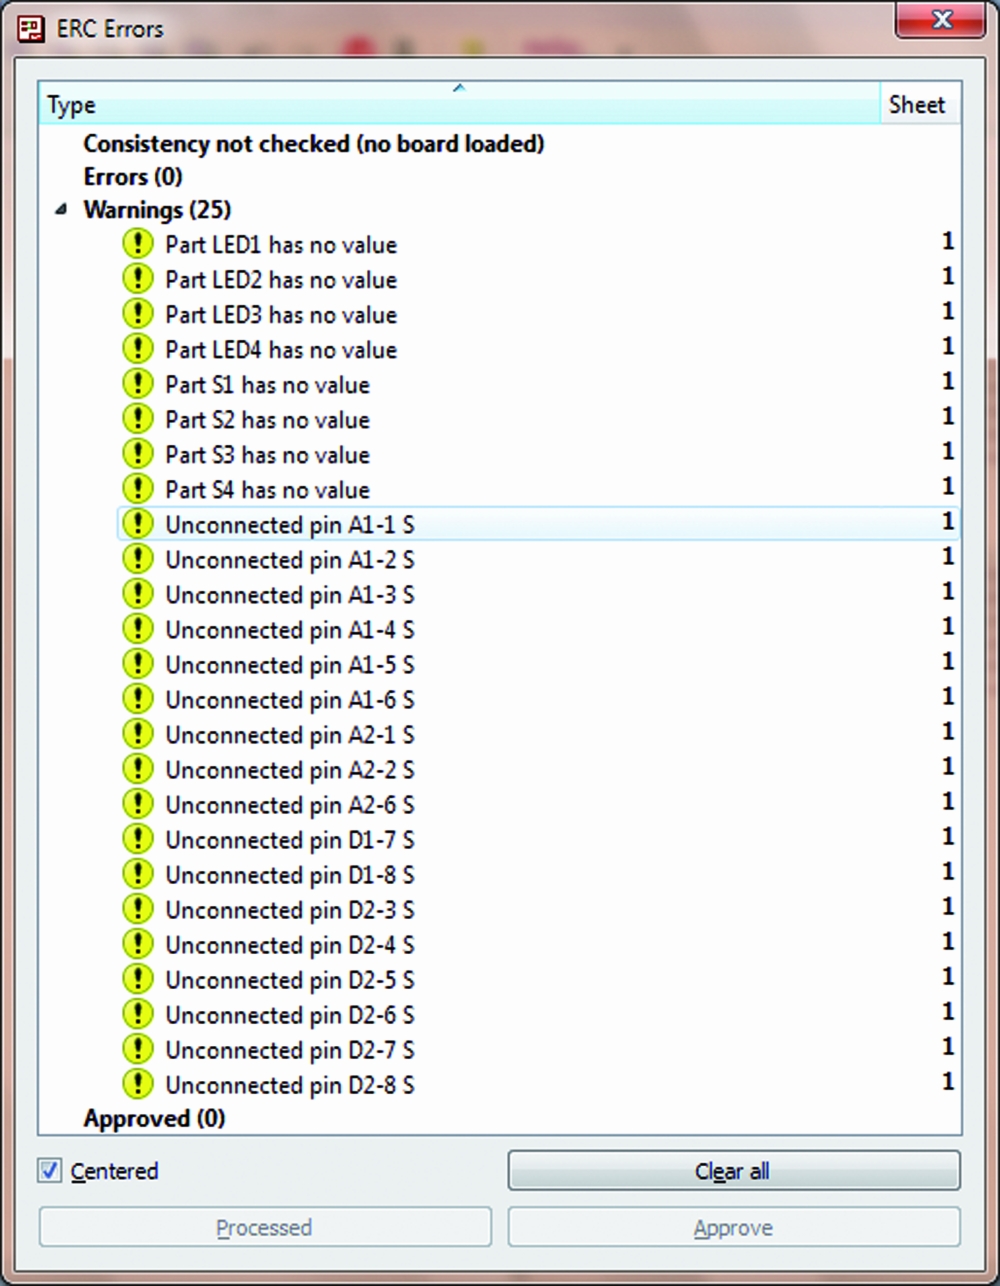
We don’t care about the missing values because they are not important in our schematic and we know that the unconnected pins are not used in our circuit. To confirm that, select “Approve” for all the requests and then with “Tools” and “”Errors” command we make sure that there are no further issues. Finally it’s time to draw the printed circuit board: left click on the “Board” icon which is the fifth starting from the left on the tool bar which is on the top of the working window.

The system will ask us if we want to create the related file so we confirm “Yes” and then we’ll have on the screen the same picture as the one shown in figure:

Using the command “Move” which can be selected by the icon with the four arrows in the left hand column, move the components where required. It’s better to start with the connectors due to they give the dimensions to the shield. Remember that the eight and the 6 pins connectors don’t have the same “step” on the board; in case of doubt check another shield, or you can refer to the pcb of the Uno which can be easily found on the Arduino’s website. The ones who have the R3 know that the strips have been redrawn to follow the increased needs of such system so the old connectors 8+8 and 6+6 have been replaced with 10+8 for digital pins and 8+6 for analog. In our example we have chosen to use the old connectors because they are compatible with all the Arduino version between 2009 and Uno and then because our shield was born for teaching reasons so it’s better to have it compatible also with the old pcb versions which are still used by many people. To insert the four connectors we can use the grid which help us; to change its resolution get access to “View”, “Grid” or “Properties” which is available by the “i” icon; in the last case we have also information about the absolute position in the working space.

Since the versions 6 of Eagleacad it is available another function which support us during drawing: “dimension” available through “Draw->Dimension”.

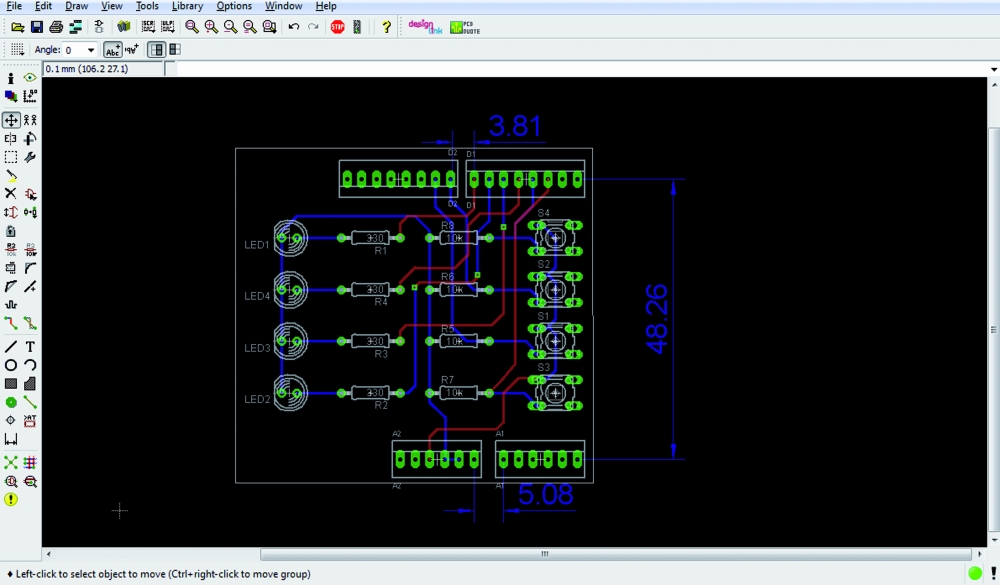
Wiring routing can be done automatically (autorouting function) or manually. In this short introduction we’ll use the hand routing in order to practice with Eaglecad. By selecting the “Route” icon it is possible to draw connections; the dimension, shape and width are visible on the top icon bar where is also possible to select the pcb side. The freeware version make possible to draw pcbs with only two sides, so we’ll find only “Top” and “Bottom”. In the same way you move components it is possible to define the printed circuit board dimensions; the white lines are the cutting boarder where the CNC will cut the pcb. Finally here a possible two sides pcb of our Arduino’s shield.

Special thanks to author Vincenzo Mendola.

-->-->-->-->-->-->
-->-->

More thoughts on EKG

Before doing the EKG lab, we should definitely discuss safety concerns,  including things like the following chart (information from http://electronicstechnician.tpub.com/14086/css/14086_34.htm):

Human reaction at 60Hz Current in mA
 Perception—slight tingling sensation  1.1
 Can’t let go (120 lb. person)—arm and hand muscles close involuntarily  10.0
 Can’t let go (175 lb. person)  16.0
 Can’t breathe—paralysis of the chest muscles  18.0
 Heart fibrillation—rapid irregular contractions of the heart muscles, which could be fatal  65.0

The very small voltages we work with (5–10 V DC) means that we rarely need to be concerned about safety issues in the lab. Most of the resistance of the body comes from the skin, and varies enormously according to how sweaty the skin is. Cleaning dead skin cells off (as is done with most preps for EKG electrodes) reduces the resistance of the skin quite a bit. DC is somewhat safer than AC, because skin is less conducting than the rest of the body, and so acts as a capacitor in parallel with a resistor. Puncturing or scraping the skin reduces resistance considerably.

It would probably be useful to have students measure the resistance between two Ag/AgCl electrodes and compute the currents that would flow at different voltages. When I tried this on two chest electrodes (just after showering, so clean, damp skin) I measured around 50kΩ. Pressing the electrodes more firmly against the skin dropped the resistance to 25 kΩ, and it gradually crept back up.

I keep thinking that the 3-wire design for EKGs is overkill. The 3rd wire seems to be just provided to bias the body to be between the power rails of the instrumentation amplifier. It should be sufficient to bias one of the electrodes with a large resistor to the reference voltage directly, rather than through the body.

I tried this.  First I hooked up the 3-wire system of the 2-stage EKG amplifier (though there was a mistake on that post, as the Rgain resistor was really 4.7kΩ, not 820Ω).  This was to make sure that I was getting good contacts and a clean signal. I then disconnected the bias lead and tried to bias the opposite end of the wires.  This did not work at all.  Disconnecting the bias wire resulted in a large signal with a period of 16.7ms (60Hz, though with a complex waveform).  Adding resistors between Vplus and Vref, Vminus and Vref, or both, just made this noise worse.  I then tried taking my body out of the loop, connecting a 25 kΩ resistor between the clip leads.  Without the biasing resistors I saw the same complex 60Hz signal.  It seems to come from capacitive coupling to the leads, as moving my hand closer or further from the leads changes the magnitude of the signal, and grounding myself eliminates it.  Putting 24kΩ resistors between Vplus and Vref and between Vminus and Vref reduced the noise, but did not eliminate it.  Touching either Vplus or Vminus was enough to produce huge noise again.

I tried another experiment, where I attached the ground electrode not to Vref directly, but through a 0.56 μF capacitor.  This worked fine, even though there was no DC bias connection for the instrumentation amp inputs!  It stopped working if I then touched either the +5V or 0V power rail—the DC bias is important, but my body was working as a pretty good capacitor, holding the DC bias for quite a while.  It is clear that the AC path to ground is crucial also.

I found that I could clean up the EKG signal by putting a 0.56 μF capacitor between Vplus and Vminus—enough that the P part of the EKG was visible.

Clean EMG with P,Q,R,S,T parts of signal all clearly visible. The remaining noise seems to be mainly quantization noise in the Arduino analog-to-digital converter, which could be reduced by increasing the amplifier gain.

Since the remaining noise seemed to be all quantization noise, I upped the amplifier gain.  Trying to raise the gain on the first stage did not work, so I raised the gain on the second stage.

Higher gain EKG circuit, with capacitor on the inputs.  The first-stage gain should be 22.02, and the second stage  18.73, for a total gain of 412.4.

The higher gain amplifier did produce good traces, with less evidence of quantization noise:

The “Arduino units” are 4.967 V/ 1024 = 4.851 mV at the output of the EKG, or 11.76µV at the electrodes. The R peaks are about 3.9mV and the S dips about -0.7mV.  The first R-R interval is 1.368 seconds for a pulse rate of 43.86 bpm.

One thing that is important—the EKG readings are resting EKGs.  If I flex the left pectoral muscle, I can swamp out the EKG signal.

Every EKG is also an EMG (electromyograph), and flexing muscles between the electrodes (here the left pectoral muscle) can swamp out the EKG signal. I computed the electrode voltage from the recorded signal, the measured Arduino A-to-D reference voltage, and the gain of the EKG amplifier. The zero-reference is determined by recording the Vref signal as well as the EKG output signal. The quantization noise from the A-to-D converter is about 3μV (less than 1 pixel in this picture).


Filed under: Circuits course, Data acquisition Tagged: Arduino, bioengineering, circuits, course design, ECG, EKG, electrocardiogram, instrumentation amplifier, op amp, pulse

Megus

Primary image

What does it do?

Can solve maze via ultrasound,Can grab object via ultrasound

Forgive my poor english..

Many thanks to LMR and special thanks to   BIRDMUN , ANTONIO.CACIUC,BASILE and   peter ROBOTFREAK

This is my first robot that is capable of solving maze(i havn't built any maze yet)


this is the begaining

The Face..(I know the cuttings are not perfect.I cut it with a soldering iron.)

Cost to build

$110,00

Embedded video

Finished project

Number

Time to build

80 hours

Type

URL to more information

Weight

4000 grams

read more

Arduino Barcamp ZgZ 2012 – Fotografías

El pasado fin de semana Arduteka, en colaboración con Cooking Hacks y el proyecto Milla Digital del ayuntamiento de Zaragoza, celebraron la Arduino Barcamp más multitudinaria realizada hasta la fecha en España.

Ponencias de todo tipo, desde impresoras 3D hasta las novedades que acontecen al mundo Arduino de la mano de David Cuartielles, pasando por algo de software libre como Plasma Active, un entorno KDE para dispositivos móviles, hicieron las delicias de todos los asistentes al evento.

Via | Arduteka

Arduino Kegerator hack checks in your homebrews on Untappd

Quite possibly the two greatest things in the world -- beer and Arduino -- have been married once again in a hack does them both justice. Accomplished maker and alcohol enthusiast Jeff Karpinski turned a spare Uno and an Ethernet shield into a gadget that automatically checks him in on Untappd. The build is connected to his kegerator through a hall-effect flow sensor that sits in his tap lines. Every time he pulls himself a pint of homebrew, the Aruino makes an API call to the so-called Foursquare for beer nerds, and updates his profile. Obviously, publishing to the site every time the keg is tapped could get messy, so there's an automatic five minute time out to avoid getting repeat hits just for topping off. There's also a button that manually engages the five minute lock out, allowing Jeff to pour his buddies a cold one without claiming the drink for himself on Untappd. And updating is a snap thanks to the simple web server that's integrated. Changing what beer is on tap in the API call is as simple as opening a web browser. Interested in upgrading your own kegerator? Check out the source link for complete instructions and a parts list.

Filed under: Misc. Gadgets, Internet

Arduino Kegerator hack checks in your homebrews on Untappd originally appeared on Engadget on Wed, 18 Jul 2012 14:49:00 EST. Please see our terms for use of feeds.

Permalink | Email this | Comments

Kegerator tallies your pints on Untappd while you sit back with a cold one

[Jeff] admits that he’s pretty well addicted to Untappd, a site he describes as a Foursquare for beer. Like his fellow beer nerds, he enjoys reporting the pints he’s had, even if they happen to be from his own stash of homebrew kegs. Untappd certainly supports this level of dedication, but it seemed silly to [Jeff] that he needed to grab his phone each time he poured himself a cold one in the comfort of his own home.

He took a look around the room and spied an Arduino doing a whole lot of nothing, so he set off to build a system that would allow him to automatically record his drinking habits without the use of his smartphone. The system is not overly complex, and measures pours using flow sensors, uploading the results to Untappd using their “check-in” API. [Jeff] was sure to include several other useful features into his build, including a lockout timer that prevents multiple check-ins when simply topping off a pint, as well as “neighbor mode” which lets you pour a round for friends without recording the pour.

Be sure to check out the build in its entirety on [Jeff’s] site, and let us know if you’re doing something equally cool with your keg setup at home.


Filed under: arduino hacks, beer hacks
Hack a Day 18 Jul 12:01

Kick Off Maker Camp with Free Shipping from the Maker Shed


For Maker Camp, our virtual summer camp for teens, most of the materials for the projects use common household items, others, such as the Compressed Air Rocket Kit in the picture, can be purchased in the Maker Shed.

To celebrate the launch of Maker Camp, the Maker Shed is offering free shipping on all orders over $50! Just use coupon code MAKERCAMP upon checkout to get the deal. It’s the perfect way to stock up on camp supplies or to take your new found skills to the next level. With everything from Arduino, to guitar kits, to tools, the Maker Shed has something for every maker.

Want to attend Maker Camp? It’s easy and free, just follow MAKE on Google+!


EKG recording working

My son and I spent some time today debugging his data logger.  I also convinced him to add some documentation, though not nearly as much as I think is needed.  This version is just a text command interface, with no GUI—the PyGUI interface he was building seemed to slow things down a lot, and is not yet ready for use.

The data logger works fine as long as the sampling interval is at least 3msec.  With 2msec sampling, I think that serial communications (over a 115200 baud USB serial connection) is getting overwhelmed.  The Arduino seems to be capable of sending out data ok at 2msec/sample, though 1msec/sample causes it to miss some timer interrupts.

If the Python program can’t empty the serial port fast enough, I think that there operating system problems. My MacBook Pro sometimes gets wedged with long runs at higher sampling rates—I’ve had to reboot it a couple of times today. If the problem is with the MacBook Pro, it may be possible to run with slightly shorter sampling intervals on faster hosts, before hitting the limits of the Arduino.

I did manage to get a nice recording for about 8.5 seconds at 3msec sampling:

Recording of EKG trace on the Arduino. The value 512 represents the midpoint of the Arduino voltage scale. The EKG circuit and Arduino used separate power supplies, so the reference voltage is about 2.506V, while AREF on the Arduino was 4.96V, so the reference voltage should be about 517.  In a separate recording of the EKG signal and Vref, I found Vref to be 515±1.  The arbitrary units are about 4.844mV at the input to Arduino.  If my gain of my EKG is set to 591 as I expect from the resistor values, the arbitrary units should correspond to 8.2µV at the electrodes, and the biggest peak is about +1.6mV and the deepest drop is about -0.24mV.

I think that the signals were clearer today, because I was using a ground electrode on my chest, rather than on my elbow, reducing the common-mode noise a little. The 3msec resolution allows zooming in to get a pretty clear view of the structure of the pulses:

Detail of a couple of pulses showing the QRS complex and the T pulse. I’m not sure whether or not a P pulse is visible—if so it is almost buried in the noise. I’ve added a line where I believe that the reference voltage is, though it was not recorded on this run. The R-R interval here is about 1251±2msec for a pulse of 0.80 Hz or 48.0 bpm, which is about my usual resting pulse.

Although it took my son and me a little debugging to get everything working today, overall I’m quite pleased with the data logger code he wrote. He still has more documentation to add (both in-code and external), and there are some more features that could be added, but it is basically usable as is.

Incidentally, I found out today from Cardiology Explained by E.A. Ashley and J. Niebauer, that

ECG terminology has two meanings for the word “lead”:

  • the cable used to connect an electrode to the ECG recorder
  • the electrical view of the heart obtained from any one combination of electrodes

So it is not surprising that I was confused by the usage—I was only familiar with the first usage, which corresponds to normal engineering terminology.


Filed under: Circuits course, Data acquisition Tagged: Arduino, bioengineering, circuits, course design, ECG, EKG, electrocardiogram, instrumentation amplifier, op amp

How to Build a Ping Pong Robot (YouTube)

Hey,

The ModuPong YouTube channel is about a modular robotics system that tracks a ping pong ball in real-time. In addition, we cover in this channel how the system predicts and responds in less than 130ms.

Please tell me if you have any ideas on how we could make our system better. Cheaper and faster would be great!

how to send sensor values wirelessly

i know how to send messages to another arduino but im not sure how to send sensor values here is code to transmit the word hello 

If you could show me an example code it would be great.

// transmitter.pde

//

// Simple example of how to use VirtualWire to transmit messages

// Implements a simplex (one-way) transmitter with an TX-C1 module

//

// See VirtualWire.h for detailed API docs

// Author: Mike McCauley (mikem@open.com.au)

// Copyright (C) 2008 Mike McCauley

read more