Introduction
It’s 2014 and the Internet-of-Things is flying along at a rapid rate with all sorts of services and devices that share data and allow control via the Internet. In the spirit of this we look a new service called plotly.
This is a “collaborative data analysis and graphing tool” which allows you to upload your own data to be analysed in many ways, and then graph the results using all sorts of plot types.
With plotly you can run your own mathematical functions over your data, run intense statistical analysis and use or edit one of the many APIs (Python, MATLAB, R, Julia, REST, Arduino, or Perl) to increase the level of customisation. Plotly works in conjunction with Google Drive to store your data, however this can be exported and imported without any issues. Futhermore plotly works best in Google Chrome.
For our review we’ll look at using plotly to quickly display and analyse data received from an Internet-connected Arduino – our EtherTen, or you can use almost any Arduino and Ethernet shield. The system isn’t completely documented however by revieiwng our example sketch and some experimenting with the interface plotly is very much usable, even in its current beta format.
Getting started with plotly
You will need to setup a plotly account, and this is simply accomplished from their main site. Some of you may be wondering what plotly costs – at the time of writing plotly is free for unlimited public use (that is – anyone can see your data with the right URL), but requires a subscription for extended private use. You can find the costs at the plans page.
Once you have a plotly account, visit your plotly home page, whose URL is https://plot.ly/~yourusername/# – then click “edit profile”. Another window will appear which amongst other things contains your plotly API key – make a note of this as you will need it and your username for the Arduino sketch.
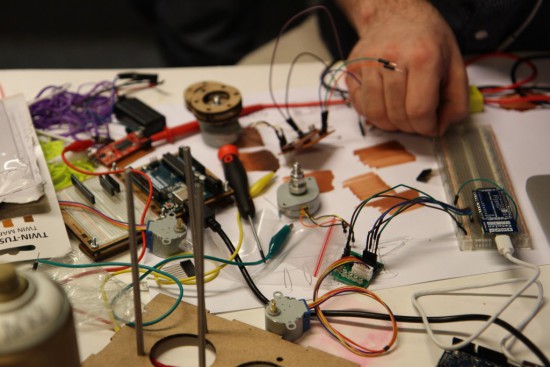
Next, you’ll need some Arduino or compatible hardware to capture the data to log and analyse. An Arduino with an Ethernet or WiFi connection, and appropriate sensors for your application. We have our EtherTen that takes readings from a temperature/humidity sensor and a light level sensor:

Now you need a new Arduino library, which is available from the plotly API page. Lots of APIs there… Anyhow, click “Arduino” and you will arrive at the github page. Download the entire .zip file, and extract the plotly_ethernet folder into Arduino libraries folder which in most installations can be found at ..\Arduino-1.0.x\libraries.

Finally we’ll use a demonstration sketch provided by plotly and modify this to our needs, which can be downloaded from github. We’ll go through this sketch and show you what to update – so have a quick look and then at out example sketch at the end of this section.
First, insert any code required to get data from your sensors and store the data in a variable – do this so the values can be used in void loop. Next, update the MAC address and the IP address of your Ethernet-enabled Arduino with the following lines:
byte mac[] = { 0xDE, 0xAD, 0xBE, 0xEF, 0xFE, 0xED };
byte my_ip[] = { 192,168,0,77 };
and change the MAC and IP if necessary. If Arduino and Ethernet is new to you, check out the tutorial. Now look for the following two lines and enter your plotly username and API key:
plotly.username = "yourplotlyusername";
plotly.api_key = "yourplotlyAPIkey";
Next – it’s a good idea to set your time zone, so the time in plots makes sense. Add the following two lines in void setup():
plotly.timestamp = true;
plotly.timezone = "Australia/Melbourne";
You can find a list of time zones available for use with plotly here. Now you need to determine how many traces and points to use. A trace is one source of data, for example temperature. For now you will have one point, so set these parameters using the following lines:
int nTraces=x; // x = number of traces
int nPoints=1;
For example, we will plot temperature, humidity and light level – so this requires three traces. The next step is to set the filename for the plot, using the following line:
char filename[] = "simple_example";
This will be sent to plotly and your data will be saved under that name. At the point in your sketch where you want to send some data back to plotly, use:
plotly.open_stream(nPoints, nTraces, filename, layout);
… then the following for each trace:
plotly.post(millis(),data);
where data is the variable to send back to plotly. We use millis() as our example is logging data against time.
To put all that together, consider our example sketch with the hardware mentioned earlier:
// Code modified from example provied by plot.ly

#include <SPI.h>
#include <Ethernet.h>
#include "plotly_ethernet.h"
#include "DHT.h"

// DHT Sensor Setup
#define DHTPIN 2               // We have connected the DHT to Digital Pin 2
#define DHTTYPE DHT22          // This is the type of DHT Sensor (Change it to DHT11 if you're using that model)
DHT dht(DHTPIN, DHTTYPE);      // Initialize DHT object
plotly plotly;                 // initialize a plotly object, named plotly

//initialize plotly global variables
char layout[]="{}";
char filename[] = "Office Weather and Light"; // name of the plot that will be saved in your plotly account -- resaving to the same filename will simply extend the existing traces with new data

float h, t, ll;
int lightLevel;

// Ethernet Setup
byte mac[] = { 0xDE, 0xAD, 0xBE, 0xEF, 0xFE, 0xED }; // doesn't really matter
byte my_ip[] = { 192, 168, 1, 77 }; // google will tell you: "public ip address"

void startEthernet(){
  Serial.println("Initializing ethernet");
  if(Ethernet.begin(mac) == 0){
    Serial.println("Failed to configure Ethernet using DHCP");
    // no point in carrying on, so do nothing forevermore:
    // try to congifure using IP address instead of DHCP:
    Ethernet.begin(mac, my_ip);
  }
  Serial.println("Done initializing ethernet");
  delay(1000);
}

void setup() {
  // Open serial communications and wait for port to open:
  Serial.begin(9600);
  while (!Serial) {
    ; // wait for serial port to connect. Needed for Leonardo only
  }

  dht.begin(); // initialize dht sensor reading
  startEthernet();    // initialize ethernet

    // Initialize plotly settings
  plotly.VERBOSE = true; // turn to false to suppress printing over serial
  plotly.DRY_RUN = false; // turn to false when you want to connect to plotly's servers
  plotly.username = "yourplotlyusername"; // your plotly username -- sign up at https://plot.ly/ssu or feel free to use this public account. password of the account is "password"
  plotly.api_key = "yourplotlyapikey"; // "public_arduino"'s api_key -- char api_key[10]
  plotly.timestamp = true; // tell plotly that you're stamping your data with a millisecond counter and that you want plotly to convert it into a date-formatted graph
  plotly.timezone = "Australia/Melbourne"; // full list of timezones is here:https://github.com/plotly/arduino-api/blob/master/Accepted%20Timezone%20Strings.txt
}

void loop()
{
  // gather data to plot
  h = dht.readHumidity(); // read humitidy from DHT pin
  t = dht.readTemperature();
  lightLevel = analogRead(A5);
  ll = lightLevel / 100; // reduce the value from the light sensor

  // Open the Stream
  plotly.open_stream(1, 3, filename, layout); // plotlystream(number_of_points, number_of_traces, filename, layout)

  plotly.post(millis(),t); // post temperature to plotly (trace 1)
  delay(150);
  plotly.post(millis(),h); // post humidity to plotly (trace 2)
  delay(150);
  plotly.post(millis(),lightLevel); // post light sensor readout to plotly (trace 3)

  for(int i=0; i<300; i++)
  { // (once every five minutes)
    delay(1000);
  }
}
After wiring up the hardware and uploading the sketch, the data will be sent until the power is removed from the Arduino.
Monitoring sensor data
Now that your hardware is sending the data off to plotly, you can check it out in real time. Log into plotly and visit the data home page – https://plot.ly/plot – for example:

Your data file will be listed – so just click on the file name to be presented with a very basic graph. Over time you will see it develop as the data is received, however you may want to alter the display, headings, labels and so on. Generally you can click on trace labels, titles and so on to change them, the interface is pretty intuitive after a few moments. A quick screencast of this is shown in this video.
To view and analyse the raw data – and create all sorts of custom plots, graphs and other analysis – click the “view data in grid” icon which is the second from the left along the bar:

At which point your data will be displayed in a new tab:

From this point you can experiment to your heart’s content – just don’t forget to save your work. In a short amount of time your data can be presented visually and analysed with ease:

Conclusion
Although plotly is still in beta form, it works well and the developers are responsive to any questions – so there isn’t much more to say but give it a try yourself, doing so won’t cost you anything and you can see how useful plotly is for yourself. And if you enjoyed this article, or want to introduce someone else to the interesting world of Arduino – check out my book (now in a third printing!) “Arduino Workshop”.

Have fun and keep checking into
tronixstuff.com. Why not follow things on
twitter,
Google+, subscribe for email updates or RSS using the links on the right-hand column, or join our
forum – dedicated to the projects and related items on this website.
Sign up – it’s free, helpful to each other – and we can all learn something.
The post Online data analysis with Arduino and plotly appeared first on tronixstuff.