Posts with «oscilloscope» label

Flip-Dot Oscilloscope is Flippin’ Awesome

Oscilloscope displays have come a long way since the round phosphor-coated CRTs that adorned laboratories of old. Most modern scopes ship with huge, high-definition touch screens that, while beautiful, certainly lack a bit of the character that classic scopes brought to the bench. It’s a good thing that hackers like [bitluni] are around to help remedy this. His contribution takes the form of what may be both the world’s coolest and least useful oscilloscope: one with a flip-dot display.

Yup — a flip-dot display, in all it’s clickedy-clacky, 25×16 pixel glory. The scope can’t trigger, its maximum amplitude is only a couple of volts, and its refresh rate is, well, visible, but it looks incredible. The scope is controlled by an ESP32, which reads the analog signal being measured. It then displays the signal via an array of driver ICs, which allow it to update the dots one column at a time by powering the tiny electromagnets that flip over each colored panel.

Even better, [bitluni] live-streamed the entire build. That’s right, if you want to watch approximately 30 hours of video covering everything from first actuating a pixel on the display to designing and assembling a PCB to drive it, then you’re in luck. For the rest of us, he was kind enough to make a much shorter summary video you can watch below. Of course, this scope doesn’t run Doom like some others, but its probably only a matter of time.

Thank to [Zane Atkins] for the tip!

Hack a Day 09 Nov 12:00

Draw on an oscilloscope with Arduino

If you’ve ever wanted to plot shapes using an oscilloscope, YouTuber Electronoobs reveals the tricks in his latest video. In it, he draws a Christmas tree, along with a few other shapes, and while that holiday is now past, there’s always the 2019. Of course, you don’t have to wait, as these concepts can be applied to anything you like throughout the year!

In the video, Electronoobs uses an Arduino Nano to produce PWM signals on two channels, filtering each of them with a capacitor and resistor. As he explains, shapes must be fairly simple, and end in the same place they started. Even with these restrictions, once the oscilloscope it turned to x/y plot mode and the signal is tuned in, the results are quite good.

In this tutorial we will use two pins from the Arduino to create fast PWM signals. With a small filter, we change the amplitude of that signal according to the width of the PWM pulse. By that, we can draw shapes on the oscilloscope when in XY mode.

Code for the project can be found in Electronoobs’ write-up here.

ArdOsc is a matchbox-sized, Arduino Nano-based oscilloscope

Oscilloscopes come in all different shapes and sizes, and now with just a few discreet components, maker Peter Balch has been able to turn an Arduino Nano into an oscilloscope the size of a matchbox. 

The simplest version of this device, which he calls the “ArdOsc,” displays data on a computer screen, but a small 1.3” OLED can also be added if you want to use it on its own.

His build write-up goes through several versions of the instrument, progressively adding capabilities including a logic display, signal generator, and other useful tools. It’s certainly worth checking out, whether you need tiny test equipment or just want to marvel at how something this small can be made!

This oscilloscope costs the price of an Arduino Nano, plus a few pence for resistors, etc. Its specifications are:

  • Max 1M samples/second, min 1000sps
  • 8-bits per sample
  • DC 0-5V; AC +/- 550mV, AC +/- 117mV, AC +/- 25mV
  • USB “PC scope” or built-in display
  • Could be battery-powered
  • Optional logic display
  • Optional frequency meter
  • Optional voltmeter

Learn Six Oscilloscope Measurements with One Arduino

We won’t mention names, but we are always dismayed to see people twist knobs randomly on a scope until it shows a good picture. These days, there’s the dreaded auto button, too, which is nearly as bad. If you haven’t spent the time to learn how to properly use a scope [Bald Engineer] has a great introduction to making six measurements with an Arduino as a test device.

To follow along you’ll need an Arduino UNO and a two-channel (or better) scope. Actually, most of the measurements would probably work on any Arduino, but there are some that require the separate USB to serial chip like that found on the UNO and similar boards.

The six measurements are:

  1. The auto reset programming pulse
  2. Capture and decode serial data
  3. Noise on the power rail
  4. Observe probe loading effects
  5. PWM duty cycle
  6. The timing of pin manipulation code

Some of these measurements use a bit of Arduino code, while others just make use of the circuitry on the board no matter what software is running.

Not only does the post show you where to make the measurements and what the result should look like, there’s also a discussion of what the measurement means and some suggested things to try on your own.

If you go through this post, you might also enjoy learning more about probes. If you are feeling adventurous, you can even build your own current probe.

Hackaday Prize Entry: Oscilloscope for the Masses

If you head down to your local electronics supply shop (the Internet), you can pick up a quality true-RMS multimeter for about $100 that will do almost everything you will ever need. It won’t be able to view waveforms, though; this is the realm of the oscilloscope. Unlike the multimeter’s realistic price point, however, a decent oscilloscope is easily many hundreds, and often thousands, of dollars. While this is prohibitively expensive for most, the next entry into the Hackaday Prize seeks to bring an inexpensive oscilloscope to the masses.

The multiScope is built by [Vítor] and is based on the STM32-O-Scope which is built around a STM32F103C8T6 microcontroller. This particular chip was chosen because of its high clock speed and impressive analog-to-digital resolution, which are two critical specifications for any oscilloscope. This particular scope has an inductance meter built-in as well, which is another feature which your otherwise-capable multimeter probably doesn’t have.

New features continue to get added to this scope by [Vítor]. Most recently he’s added features which support negative voltages and offsets. His particular scope is built inside of a model car, too, but we believe this to be an optional feature.


Filed under: The Hackaday Prize, tool hacks

Improve your programming skills with an oscilloscope

Starting a new project is always an effective way to hone your skills while exploring circuitry and programming. To help improve his engineering chops, Joop Brokking recently bought an inexpensive oscilloscope (a device for visualizing voltage over time in an x-y graph) and connected it to an Arduino Uno. He then shared his findings in a detailed tutorial on YouTube.

In the video below, Brokking is using a Hantek 6022BE 20MHz dual-channel oscilloscope and provides three examples to better understand what can go wrong when building a simple Arduino setup.

Arduino Blog 31 Oct 03:09

Pressure sensor with air pump

I’ve been thinking of expanding the pressure sensor lab for the Applied Circuits Course to do something more than just measure breath pressure.  Perhaps something that conveys another physics or engineering concept.

One thing I thought of doing was measuring the back pressure and air flow on an aquarium air pump bubbling air into an aquarium. Looking at the tradeoff of flow-rate and back pressure would be a good characterization of an air pump (something I wish was clearly shown in advertisements for aquarium air pumps and air stones).  Measuring flow rate is a bit of a pain—about the best I could think of was to bubble air into an inverted soda bottle (or other known volume) and time it.

This would be a good physics experiment and might even make a decent middle-school product-science science fair project (using a cheap mechanical low-pressure gauge, rather than an electronic pressure sensor), but setting up tanks of water in an electronics lab is a logistic nightmare, and I don’t think I want to go there.

I can generate back pressure with just a simple clamp on the hose, though, and without a flow rate measurement we could do everything completely dry.

Setup for measuring the back pressure for an aquarium air pump (needs USB connection for data logger and power).

Using the Arduino data loggger my son wrote, I recorded the air pressure while adjusting the clamp (to get the y-axis scale correct, I had to use the estimated gain of the amplifier based on resistor sizes used in the amplifier).

The peak pressure, with the clamp sealing the hose shut, seems to be about 14.5 kPa (2.1psi).

I was interested in the fluctuation in the pressure, so I set the clamp to get about half the maximum back pressure, then recorded with the Arduino data logger set to its highest sampling frequency (1ms/sample).

The fluctuation in back pressure seems to have both a 60Hz and a 420Hz component with back pressure at about half maximum.

Because the Arduino data logger has trouble dealing with audio frequency signals, I decided to take another look at the signals using the Bitscope pocket analyzer.

The waveform for the pressure fluctuations from the AQT3001 air pump, with the back pressure about 7.5kPa (half the maximum).

One advantage of using the Bitscope is that it has FFT analysis:

Spectrum for the back pressure fluctuation. One can see many of the multiples of 60Hz, with the particularly strong peak at 420Hz.

I was also interested in testing a Whisper40 air pump (a more powerful, but quieter, pump). When I clamped the hose shut for that air pump, the hi-gain output of the amplifier for the pressure sensor saturated, so I had to use the low gain output to determine the maximum pressure (24.8kPA, or about 3.6psi). The cheap Grafco clamp that I used is a bit hard to get complete shutoff with (I needed to adjust the position of the tubing and use pliers to turn the knob).  It is easy to get complete shutoff if the tube is folded over, but then modulation of less than complete shutoff is difficult.

The fluctuation in pressure shows a different waveform from the AQT3001:

The Whisper40 air pump, with the clamp set to get a bit less than half the maximum back pressure, produces a 60Hz sawtooth pressure waveform, without the strong 420Hz component seen from the AQT3001. The peak-to-peak fluctuation in pressure seems to be largest around this back pressure. The 3kPa fluctuation is larger than for the AQT3001, but the pump seems quieter.

The main noise from the pump is not from the fluctuation in the pressure in the air hose, but radiation from the case of the pump. That noise seems to be least when the back pressure is about 1.1kPa (not at zero, surprisingly). The fluctuation is then all positive pressure, ranging from 0 to 2.2kPa and is nearly sinusoidal, with some 2nd and 3rd harmonic.

As the back pressure increases for the Whisper40, the 2nd, 3rd, and 4th harmonics get larger, but the 60Hz fundamental gets smaller. The 4th harmonic is maximized (with the 1st through 4th harmonics almost equal) at about 22.8kPa, above which all harmonics get smaller, until the air hose is completely pinched off and there is no pressure variation.

When driving the large airstone in our aquarium, the Whisper40 has a back pressure of about 7.50kPa (1.1psi) with a peak-to-peak fluctuation of about 2.6kPa.

I’m not sure whether this air-pump back-pressure experiment is worth adding to the pressure sensor lab.  If I decide to do it, we would need to get a dozen cheap air pumps.  The Tetra 77853 Whisper 40 air pump is $11.83 each from Amazon, but the smaller one for 10-gallon aquariums is only $6.88.  With 12 Ts and 12 clamps, this would cost about $108, which is not a significant cost for the lab.


Filed under: Circuits course, Data acquisition, Pressure gauge Tagged: air pump, Arduino, BitScope, circuits, data acquisition, data logger, instrumentation amp, oscilloscope, pressure sensor, science fair, USB oscilloscope

Quasi real-time oscilloscope: REMIX

 Updated on 21 Sept. 2012, version 4.

 Updated on 15 Oct. 2012, version 5.

Recently I was reviewing one of my oldest project, and decided to “refresh” previous design by taking full advantage of the new arduino Leonardo board.  Based on AtMega32U4, which include PGA (programmable gain amplifier), oscilloscope’s  analog front end doesn’t require external OPA this time, end could be build in 1-2 hours on prototype board, using 5 resistors, 5 capacitors and one IC. Short specification:

  • Four channels.
  • Switchable gain settings 1x, 10x, 40x, 200x.

Hardware.

 As you can see on drawings above, inputs are AC coupled with caps, and biased with 1.25V generated by LM317. Connector for other two inputs not installed yet.

Software.

Project keeps almost same  structure of commands (CLI – command line interface) as its ancestor, with only two new for channel and gain selection. Read comments, it explains how to use them. One more things, I removed “r” – re-print option from the list of available commands.

Have fun!.

Link to arduino Leonardo sketch:  Oscilloscope_Leonardo.

********************************************* Version 4*********************************************

 Well, even posted above sketch has low complexity, and its good for beginning, nevertheless it’s quite limited as measuring device. The most important feature for oscilloscope, except V/div,  is T/div, or timing, that has to be as much precise as possible.   This is why “standard” timing options based on TIMER1 were add to next version of software. There are 9 time settings Time/div (10 samples):

50ms, 20ms, 10ms, 5ms, 2ms, 1ms, 500us, 200us, 100usec

corresponding to

200Hz, 500Hz, 1kHz, 2kHz, 5kHz, 10kHz, 20kHz, 50kHz, 100kHz

sampling rate. You can choose any of of this in the same manner, entering a digit 1-9 and letter d (display). Zero would skip capture, and just do whatever next letter request. Basically, 0 should be used to print channels data from memory. Combination: 9d0i – capture at 100 kHz rate, print chart and info-table,
4c2g7d – select 4-th channel, set gain to 10, select 20 kHz sampling rate and display.

I also add multichannel sampling capability. Commands 2m, 3m or 4m would configure oscilloscope for 2, 3 or 4 channels simultaneously capturing input waveform.   As arduino has only 1 ADC, switching in multichannel mode would reduce sampling rate proportionally to number of channels, and this changes would be reflected in right top corner of the display. What more, arduino would automatically change vertical resolution per channel, to fit all 2 – 4 charts on one screen!

Known caveats:

  • Sampling rate 9, or 100 usec per division (10 usec per sample) could not be selected in multichannel mode, should be in use for single channel only (1m, 1c – 2c – 3c – 4c).
  • There is a “shift” in channel number, signal  presented at input 1 would show up on screen 2, and so on. This happens on time settings 7 (occasionally), 8 and 9 in 4x multichannel mode due delay in MUX registers switching. Shouldn’t be an issue for 2x channel mode, or when you have an “overview” of the signals shape in single channel mode (1m) before switching to 4x, so you would know what to expect at each input port.

Link to arduino Leonardo sketch:  Oscilloscope_LeonardoV4

********************************************* Version 5*********************************************

 New updated version. I was thinking how to improve simplest ever oscilloscope, and have made some structural changes in the code, mostly related to sampling in multichannel mode.

First of all, instead of “delay” 2 microseconds, that was used to give a multiplexer (and PGA amplifier) time to “settle” on new channel, I decided not to waste a time (that may be priceless in real-time application), rather start new conversion, than track samples based on the “history” of MUX settings, and store new sample in corresponding two dimensional array box. Now MUX and PGA would have more time,  and consequently I could reduce ADC pre-selector’s clock to get better readings. It solved all the problems with wrong association port number and picture on the screen.

Secondly,  as you, probably, already notice I’ve been working on another project recently, where phase is a PRIME factor of the whole idea of the design. Phase noise is a jitter, and it degrades  spatial resolution and the sensitivity of the sound localization.  Jitter always would be presented in the incoming signal – sampled waveform due “not synchronous” way of sampling, as “start new conversion” events were generated in “manual” mode. As microprocessor spend different amount of time to get inside of the ISR (interrupt subroutine) depends on where it was interrupted, time frame of the events, basically, was not defined. In order to get rid off the phase noise, I changed ADC settings to be triggered via TIMER 1. There is a code:

ADCSRA = ((1<< ADEN)| // 1 = ADC Enable
(0<< ADSC)| // 1 = ADC Start Conversion
(1 <<ADATE) | / / 1 = ADC Auto Trigger Enable
*****
ADCSRB = ((1<<ADHSM)| // High Speed mode select
(0<< MUX5)| // 0 (10100) ADC1<->ADC4 Gain = 1x.
(0<<ADTS3)|
(1 <<ADTS2) | / / Sets Auto Trigger source Timer/Counter1 Compare Match B
(0 <<ADTS1) |
(1 <<ADTS0) );

For some unknown for me reason, Atmel designed TIMER 1 channel B to be an auto trigger source of the ADC, the same time to run TIMER 1 itself in CTC mode, channel A must be set. I simply “bind” two channels A and B in “parallel”, so both of them rise interrupt flag at the same moment, only A re-starts a TIMER 1, and B generates “start new conversion” event and calling ISR for “maintenance” – take a new sample waiting in the line and switch a MUX to another channel of the oscilloscope.

uint8_t take_it( int fast )
{
   ADCSRA &= 0xF8;
   if ( multChan -1 )
   {
    switch( fast ) { 
       case 7: // 20 kHz / 
         ADCSRA |= 0×03; 
         break; 
       case 8: // 50 kHz / 
         ADCSRA |= 0×02; 
         break; 
       case 9: // 100 kHz / 
         Serial.print(F(“\n\t *** NOT SUPPORTED ***”));
         return 0;
        default:
        ADCSRA |= 0×04;
       }
     }
    else
    { 
     switch( fast ) { 
        case 6: // 10 kHz / 
          ADCSRA |= 0×06; 
          break; 
        case 7: // 20 kHz / 
          ADCSRA |= 0×05; 
          break; 
        case 8: // 50 kHz / 
          ADCSRA |= 0×04; 
          break; 
        case 9: // 100 kHz / 
          ADCSRA |= 0×03; 
          break; 
        default:
          ADCSRA |= 0×07;
        }
      }
OCR1A   = smplTime[fast -1];
OCR1B   = smplTime[fast -1];
TCNT1   = 0;
TIFR1    |= (1<<OCF1B); 
TIMSK1 |= (1<<OCIE1B);
   flagSamp = 0; 
   while ( !flagSamp );
   for ( uint8_t indx, y = 0; y < multChan; y++){
      if ( multChan -1) indx = y;
      else indx = chanNumb;
   for ( int i = 0; i < INBUF; i++){
      if ( x[indx][i] & 0×0200) x[indx][i] += 0xFE00; // Convert to negative 16-bit word (2′s comp)
      else x[indx][i] += 0×200;
      }
     }
  return 1;
}
ISR(TIMER1_COMPB_vect)
{
   static uint8_t n_sampl = 0;
   static uint8_t history = 0;
   x[history][n_sampl] = ADC;
    history = chanNumb; 
   if ( multChan -1 )
   { 
    chanNumb++;
    if ( chanNumb >= multChan )
      {
       chanNumb = 0;
       n_sampl++;
      }   
     ADMUX &= 0xFC;
     ADMUX |= chanNumb; 
    }
   else
   {
     n_sampl++;
    }
   if ( n_sampl >= INBUF )
    {
      flagSamp = 1;
      n_sampl = 0;
TIMSK1 &= ~(1<<OCIE1B);
   }
}

Oscilloscope_Leonardo_V5.

The only issue that not solved yet, is a sampling in multichannel mode in “9″ T/div. Probably, Atmel just was not design to do such things…


Supplemental sheet for lab, draft 1

In my previous post, I said that I would post drafts of my supplemental sheets describing the course here on my blog, to get feedback before submitting them. Since I’ve been thinking more about the labs than the lectures, I’ll try writing the sheet for the lab first. It will be based, in part, on my prior list of lab topics, somewhat updated.

Undergraduate Supplemental Sheet
Information to accompany Request for Course Approval
Sponsoring Agency Electrical Engineering
Course #
102L (I need to get a number from the department that they are not currently using. Since we are planning the course as an alternative prerequisite to EE 104 in place of EE101+L, I think that 102 would be a good number, with the L suffix for the lab course.)
Catalog Title
Applied Circuits Lab

Please answer all of the following questions using a separate sheet for your response.
1. Are you proposing a revision to an existing course? If so give the name, number, and GE designations (if applicable) currently held.

This is not a revision to any existing course.

2. In concrete, substantive terms explain how the course will proceed. List the major topics to be covered, preferably by week.

  1. Thermistor lab
    The lab will start with having students learn about the test equipment by having them use the multimeters to measure other multimeters. What is the resistance of a multimeter that is measuring voltage? of one that is measuring current? what current or voltage is used for the resistance measurement? The first lab will then have three parts, all involving the use of a Vishay BC Components NTCLE413E2103F520L thermistor or equivalent.

    First, the students will use a bench multimeter to measure the resistance of the thermistor, dunking it in various water baths (with thermometers in them to measure the temperature). They should fit a simple curve to this data (warning: temperature needs to be on an absolute scale).

    Second, they will add a series resistor to make a voltage divider. They have to choose a value to get as large and linear a voltage response as possible at some specified “most-interesting” temperature (perhaps body temperature, perhaps room temperature, perhaps DNA melting temperature). There will be a pre-lab exercise where they derive the formula for maximizing . They will then measure and plot the voltage output for the same set of water baths. If they do it right, they should get a much more linear response than for their resistance measurements.

    Finally, they will hook up the voltage divider to an Arduino analog input and record a time series of a water bath cooling off (perhaps adding an ice cube to warm water to get a fast temperature change), and plot temperature as a function of time.EE concepts needed: voltage, resistance, voltage divider, notion of a transducer.

    Lab skills developed: use of multimeter for measuring resistance and voltage, use of Arduino with data-acquisition program to record a time series, fitting a model to data points, simple breadboarding.

    Equipment needed: multimeter, power supply, thermistor, selection of various resistors, breadboard, clip leads, thermoses for water baths, secondary containment tubs to avoid water spills in the electronics lab. Arduino boards will be part of the student-purchased lab kit (separate from rest of kit, so that students can use Arduinos previously purchased). All uses of the Arduino board assume connection via USB cable to a desktop or laptop computer that has the data logger software that we will provide.

  2. Electret microphone

    First, we will have the students measure and plot the DC current vs. voltage for the microphone. The microphone is normally operated with a 3V drop across it, but can stand up to 10V, so they should be able to set the Agilent E3631A power supply to various values from 0V to 10V and get the voltage and current readings directly from the bench supply, which has 4-place accuracy for both voltage and current. There is some danger of the students accidentally delivering too much voltage and frying the mic, but as long as they get the polarity right, that isn’t too big a hazard. Ideally, they should see that the current is nearly constant as voltage is varied—nothing like a resistor.

    Second, we will have them do current-to-voltage conversion with a 5v power supply to get a 2.5v DC output from the microphone and hook up the output of the microphone to the input of the oscilloscope. Input can be whistling, talking, iPod earpiece, … . They should learn the difference between AC-coupled and DC-coupled inputs to the scope, and how to set the horizontal and vertical scales of the scope.

    Third, we will have them design and wire their own DC blocking RC filter (going down to about 1Hz), and confirm that it has a similar effect to the AC coupling on the scope.

    Fourth, they will play sine waves from the function generator through a loudspeaker next to the mic, observe the voltage output with the scope, and measure the voltage with a multimeter, plotting output voltage as a function of frequency. Note: the specs for the electret mic show a fairly flat response from 50Hz to 3kHz, so most of what the students will see here is the poor response of a cheap speaker at low frequencies.

    Those with extra time could look at putting the speaker and mic at opposite ends of tube and seeing what difference that makes.EE concepts: current sources, AC vs DC, DC blocking by capacitors, RC time constant, sine waves, RMS voltage, properties varying with frequency.

    Lab skills: power supply, oscilloscope, function generator, RMS AC voltage measurement.

    Equipment needed: multimeter, oscilloscope, function generator, power supply, electret microphone, small loudspeaker, selection of various resistors, breadboard, clip leads.

  3. Electrode measurements

    First, we will have the students attempt to measure the resistance of a saline solution using a pair of stainless steel electrodes and a multimeter. This should fail, as the multimeter gradually charges the capacitance of the electrode/electrolyte interface.

    Second, the students will use a voltage divider, with 10–100Ω load resistor and the function generator driving the voltage divider. The students will measure the RMS voltage across the resistor and across the electrodes for different frequencies from 3Hz to 300kHz (the range of the AC measurements for the Agilent 34401A Multimeter). They will plot the magnitude of the impedance of the electrodes as a function of frequency and fit an R2+(R1||C1) model to the data. A little hand tweaking of parameters should help them understand what each parameter changes about the curve.

    Third, the students will repeat the measurements and fits for different concentrations of NaCl, from 0.01M to 1M. Seeing what parameters change a lot and what parameters change only slightly should help them understand the physical basis for the electrical model.

    Fourth, students will make Ag/AgCl electrodes from fine silver wire. The two standard methods for this involve either soaking in chlorine bleach or electroplating. To reduce chemical hazards, we will use the electroplating method. Students will calculate the area of their electrodes and the recommended electroplating current, and adjust the bench supplies to get the desired current.

    Fifth, the students will measure and plot the resistance of a pair of Ag/AgCl electrodes as a function of frequency (as with the stainless steel electrodes).

    Sixth, if there is time, students will measure the potential between a stainless steel electrode and an Ag/AgCl electrode.EE concepts:magnitude of impedance, series and parallel circuits, variation of parameters with frequency, limitations of R+(C||R) model.

    Electrochemistry concepts: At least a vague understanding of half-cell potentials. Ag → Ag+ + e-, Ag+ + Cl- → AgCl, Fe + 2 Cl-→ FeCl2 + 2 e-.

    Lab skills: bench power supply, function generator, multimeter, fitting functions of complex numbers, handling liquids in proximity of electronic equipment.

    Equipment needed: multimeter, function generator, power supply, stainless steel electrode pairs, silver wires, frame for mounting silver wire, resistor, breadboard, clip leads, NaCl solutions in different concentrations, beakers for salt water, secondary containment tubs to avoid salt water spills in the electronics lab.

  4. Sampling and Aliasing

    Students will use a PC board that samples and digitizes an input with an 8-bit ADC, then reconstructs the waveform with a DAC. An existing lab has been used in other EE courses for explaining and demonstrating aliasing of sampled signals using this board, a signal generator, and a dual-trace oscilloscope. Note: this is a student-executed demo, rather than a design or measurement lab.EE concepts: quantized time, quantized voltage, sampling frequency, Nyquist frequency, aliasing.

    Lab skills: dual traces on oscilloscope.Equipment needed: ADC/DAC board, dual-trace oscilloscope, function generator.

  5. Audio amplifier

    Students will use an op amp to build a simple non-inverting audio amplifier for an electret microphone, setting the gain to around 6 or 7. Note that we are using single-power-supply op amps, so they will have to design a bias voltage supply as well.If this lab is too short, then students could feed the output of the amplifier into an analog input of the Arduino and record the waveform at the highest sampling rate they can with the software we provide (probably around 300–500 Hz). This would again demonstrate aliasing.EE concepts: op amp, DC bias, bias source with unity-gain amplifier, AC coupling, gain computation.

    Lab skills: complicated breadboarding (enough wires to have problems with messy wiring). If we add the Arduino recording, we could get into interesting problems with buffer overrun if their sampling rate is higher than the Arduino’s USB link can handle.

    Equipment needed: breadboard, op amp chip, assorted resistors and capacitors, electret microphone, Arduino board, optional loudspeaker.

  6. Capacitive touch sensor

    The students will build an op-amp oscillator (a square-wave one, not a sine wave) whose frequency is dependent on the parasitic capacitance of a touch plate, which the students can make from Al foil and plastic food wrap. Students will have to measure the frequency of the oscillator with and without the plate being touched.

    Instead of breadboarding, students will wire this circuit by soldering wires and components on a PC board designed for prototyping op amp and instrumentation amp circuits.
    We will also provide a simple Arduino program that is sensitive to changes in the period of the oscillator and turns an LED on or off, to turn the frequency change into an on/off switch.EE concepts: frequency-dependent feedback, oscillator, RC time constants, parallel capacitors.

    Lab skills: soldering. Frequency measurement with multimeter.

    Equipment needed: Power supply, multimeter, Arduino, clip leads, amplifier prototyping board, oscilloscope.

  7. Phototransistor

    The details of this lab have not been worked out yet. It will probably involve either making a photointerrupter switch or making and characterizing an optoisolater made from an infrared LED and a phototransistor.EE concepts: LEDs and phototransistors (maybe also photodiodes and photoresistors), optoisolators.

    Equipment needed: breadboard, LED, phototransistor, resistors, function generator, oscilloscope, multimeter.

  8. Pressure sensor 1—instrumentation amplifier

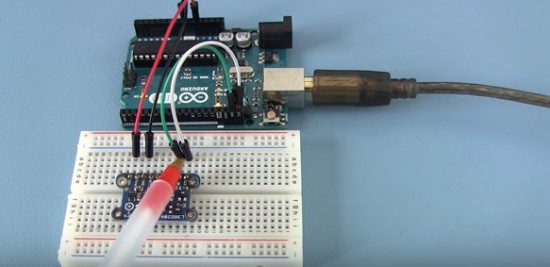
    Students will design an instrumentation amplifier with a gain of 300 or 500 to amplify the differential strain-gauge signal from a medical-grade pressure sensor (the Freescale MPX2300DT1), to make a signal large enough to be read with the Arduino A/D converter. The circuit will be soldered on the instrumentation amp/op amp protoboard.The sensor calibration will be checked with water depth in a small reservoir. Note: the pressure sensor comes in a package that exposes the wire bonds and is too delicate for student assembly by novice solderers. We will make a sensor module that protects the sensor and mounts the sensor side to a 3/4″ PVC male-threaded plug, so that it can be easily incorporated into a reservoir, and mounts the electronic side on a PC board with screw terminals for connecting to student circuits.

    EE concepts: differential signals, twisted-pair wiring, strain gauge bridges, instrumentation amplifier, DC coupling, gain.

    Equipment needed: Power supply, amplifier prototyping board, oscilloscope, pressure sensor mounted in PVC plug with breakout board for easy connection, water reservoir made of PVC pipe, secondary containment tub to avoid water spills in electronics lab.

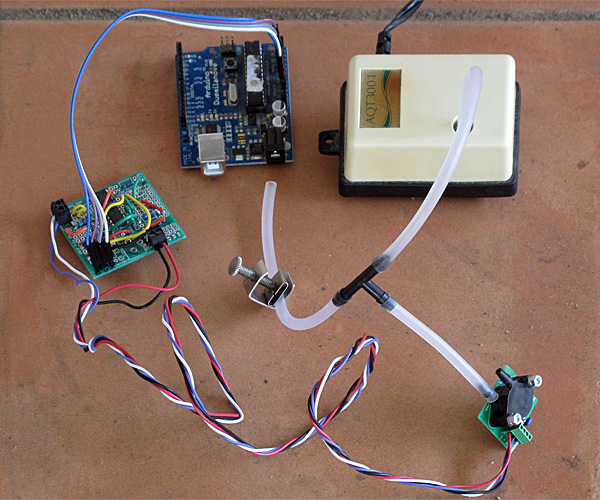
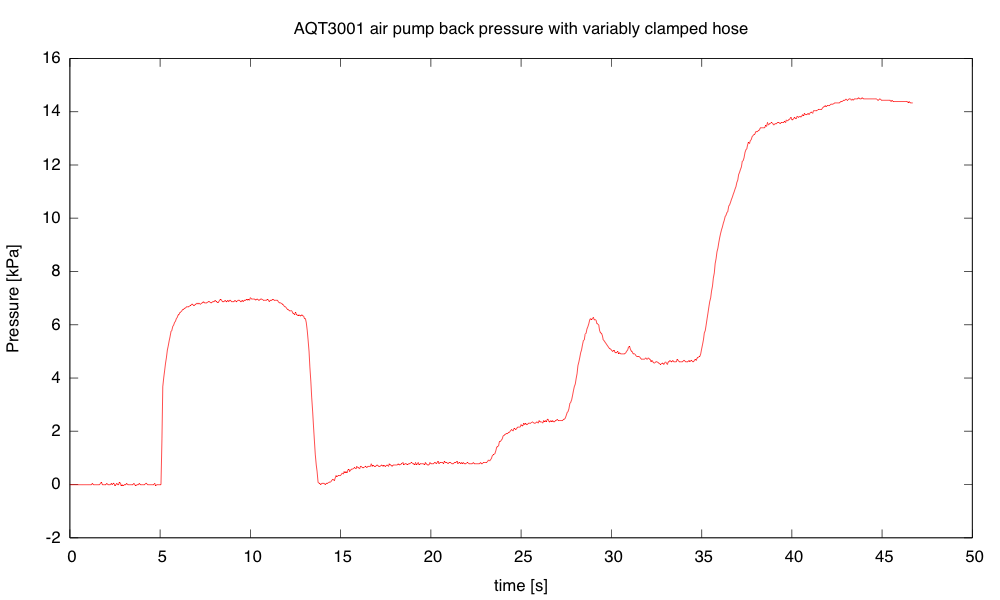
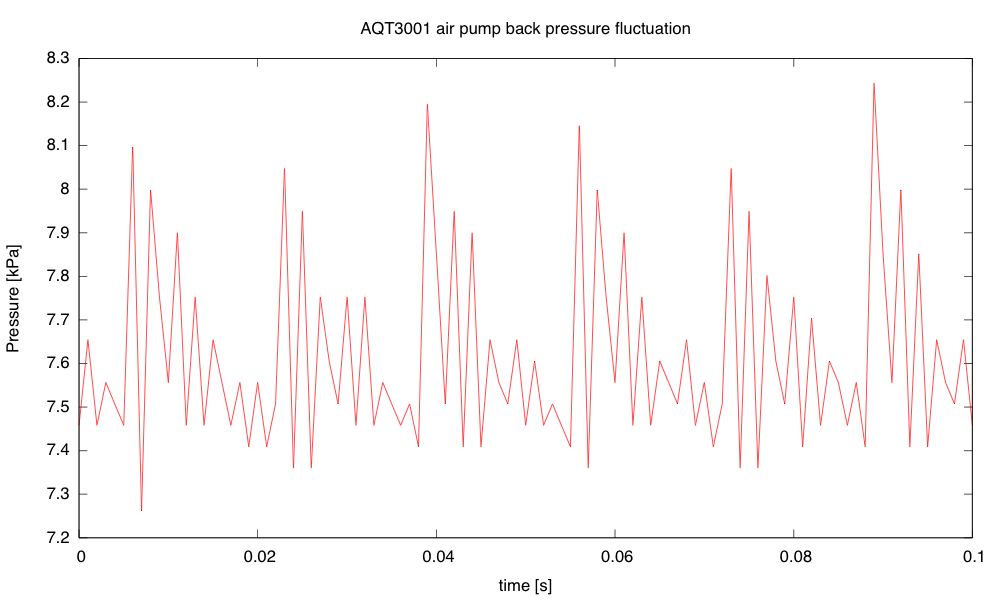
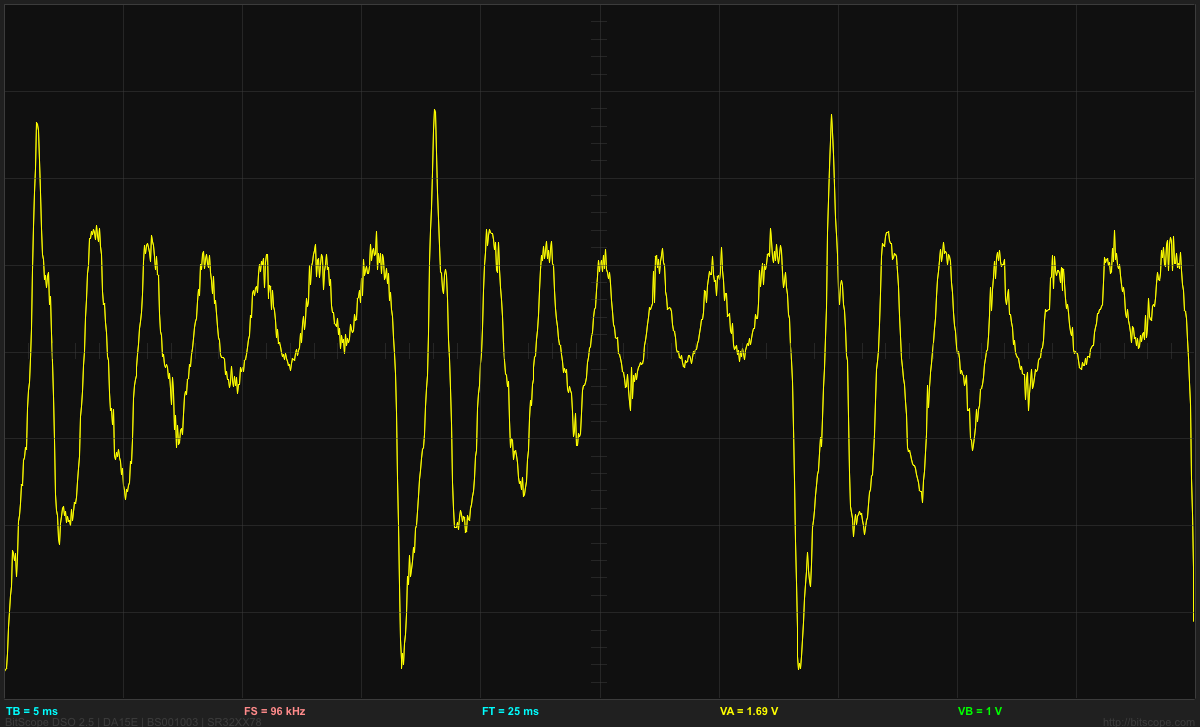
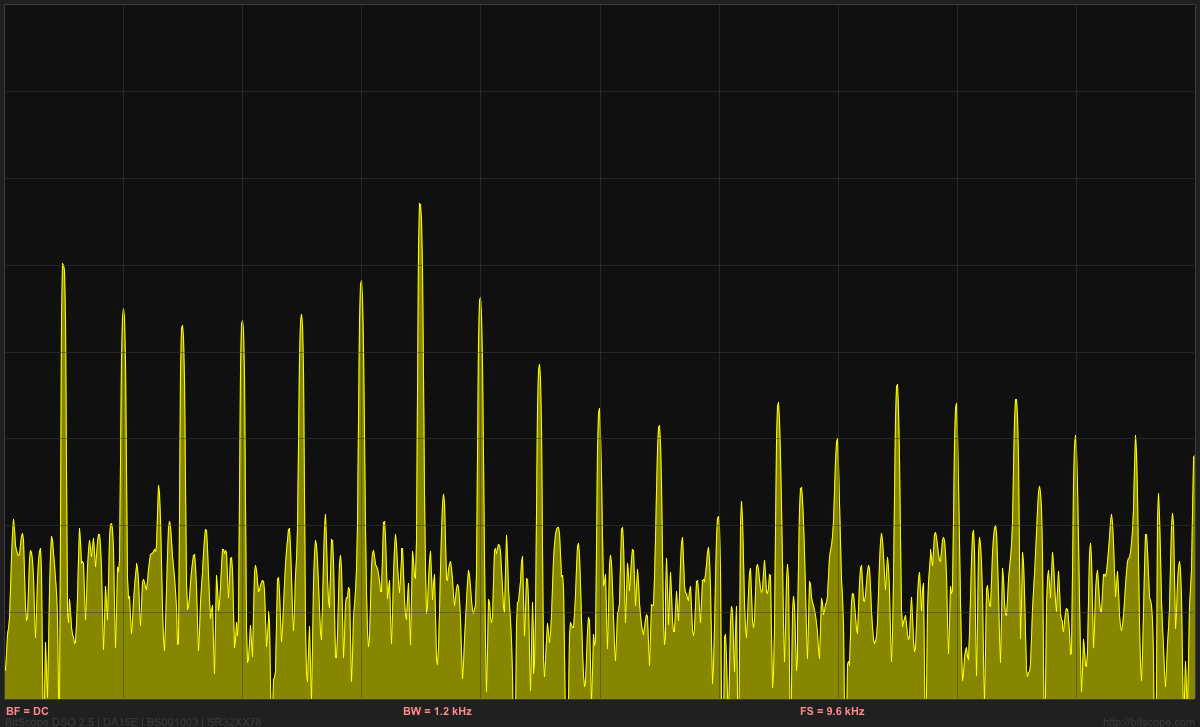
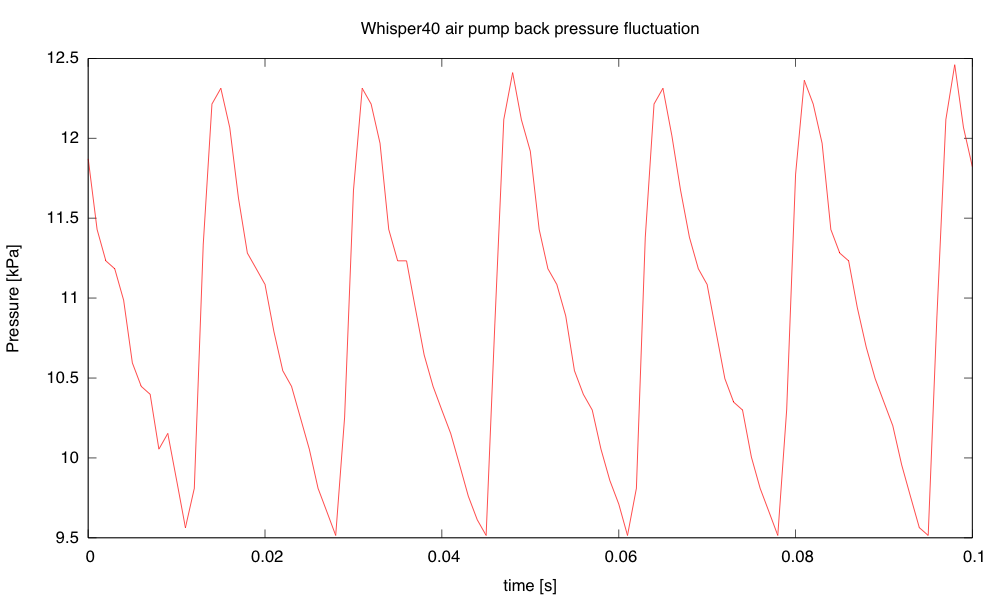
  9. Pressure sensor 2—modeling fluidics with linear circuits
    Students will use the pressure sensors and amplifiers from the previous labs to characterize a pair of water reservoirs connected by a flexible hose. The details of the lab are still being worked out.Students will either induce a step change in pressure in one reservoir and record the step response in each reservoir, or will mount one reservoir on a homemade shaker table driven by a function generator and an audio amplifier.EE concepts: hydraulic analogy, frequency response (both amplitude and phase).

    Equipment needed: Power supply, amplifier prototyping board, oscilloscope, Arduino, pressure sensor mounted in PVC plug with breakout board for easy connection, 2 water reservoirs made of PVC pipe, hose connections, secondary containment tub to avoid water spills in electronics lab, possibly home-made shaker table. Note: the shaker table and power amplifier is the most expensive piece of equipment not already in the lab: it will cost about $50 to build.

  10. Electrocardiogram EKG

    Students will design and solder an instrumentation amplifier with a gain of 2000 and bandpass of about 0.1Hz to 100Hz. The amplifier will be used with 3 disposable EKG electrodes to display EKG signals on the oscilloscope and record them on the Arduino.Equipment needed: Instrumentation amplifier protoboard, EKG electrodes, alligator clips, Arduino, oscilloscope.

3. Systemwide Senate Regulation 760 specifies that 1 academic credit corresponds to 3 hours of work per week for the student in a 10-week quarter. Please briefly explain how the course will lead to sufficient work with reference to e.g., lectures, sections, amount of homework, field trips, etc. [Please note that if significant changes are proposed to the format of the course after its initial approval, you will need to submit new course approval paperwork to answer this question in light of the new course format.]

This is a 2-unit course. Three hours a week will be spent in scheduled labs, another 3 hours a week in pre-lab design activity and post-lab write-ups.

4. Include a complete reading list or its equivalent in other media.

Wikipedia book: http://en.wikipedia.org/wiki/User:Kevin_k/Books/applied_circuits
Because no existing textbook covers all the material of the course, collection of relevant Wikipedia articles has been made that covers all the major topics. The book is available online for free, but students can purchase a printed and bound version (about 350 pages), if they want. Some of the Wikipedia articles contain more detail than is needed for the course, but about 90% of the content is relevant and will be required.

Data sheets: Students will be required to find and read data sheets for each of the components that they use in the lab.

Op amps for everyone by Ron Mancini http://www.e-booksdirectory.com/details.php?ebook=1469 Chapters 1–6 This free book duplicates some of the material in the Wikipedia book, but provides more detail and a cleaner presentation of some of the op-amp material.

Op Amp Applications Handbook by Analog Devices http://www.analog.com/library/analogDialogue/archives/39-05/op_amp_applications_handbook.html has some useful material, particularly in Sections 1-1 and 1-4, but is generally too advanced for a first circuits course. Readings in this book will be optional for the more advanced students.

The classic book The Art of Electronics by Horowitz and Hill has one of the best presentations of op amps in Chapter 4. Chapters 1 and 4, and parts of Chapters 5 and 7 are relevant to this course. Unfortunately, the book is now 23 years old and much of the description of specific chips is obsolete, but the book is still quite expensive. We will provide page and section numbers for optional readings in this book that correspond to the readings in the main texts, but not require this book.

5. State the basis on which evaluation of individual students’ achievements in this course will be made by the instructor (e.g., class participation, examinations, papers, projects).

Students will be evaluated on in-lab demonstrations of skills and on the lab write-ups.

6. List other UCSC courses covering similar material, if known.

EE 101L covers some of the same basic electronic lab skills, but without the focus on sensors or design, and without instrumentation amps.

Physics 160 offers a similar level of practical electronics, but focuses on physics applications, rather than on bioengineering applications, and is only offered in alternate years.

7. List expected resource requirements including course support and specialized facilities or equipment for divisional review. (This information must also be reported to the scheduling office each quarter the course is offered.)

The course will need the equipment of a standard analog electronics teaching lab: power supply, multimeter, function generator,  oscilloscope, and computer plus soldering irons. The equipment in Baskin Engineering 150 (used for EE 101L) is ideally suited for this lab. There are 24 stations in the lab, but only 12 function generators. Adding a dozen $300 function generators would make all 24 stations simultaneously usable, but the lab could be run with only half the stations, if all labs requiring function generators are done only with student pairs rather than individuals.

In addition, a few special-purpose setups will be needed for some of the labs. The special-purpose equipment was designed to be easily constructed with simple tools and to cost around $50/setup. One of the teachers is prototyping all the lab setups at home, to make sure that they can be effectively made within budget without expensive parts or much shop time.

There are a number of consumable parts used for the labs (integrated circuits, resistors, capacitors, PC boards, wire, and so forth), but these are easily covered by standard School of Engineering lab fees.

The course requires a faculty member (simultaneously teaching the co-requisite Applied Circuits course) and a teaching assistant (for providing help in the labs and for evaluating student lab demonstrations).

8. If applicable, justify any pre-requisites or enrollment restrictions proposed for this course. For pre-requisites sponsored by other departments/programs, please provide evidence of consultation.

Students will be required to have single-variable calculus and a physics electricity and magnetism course. Both are standard prerequisites for any circuits course. Although DC circuits can be analyzed without calculus, differentiation and integration are fundamental to AC analysis. Students should have already been introduced to the ideas of capacitors and inductors.

9. Proposals for new or revised Disciplinary Communication courses will be considered within the context of the approved DC plan for the relevant major(s). If applicable, please complete and submit the new proposal form (http://reg.ucsc.edu/forms/DC_statement_form.doc or http://reg.ucsc.edu/forms/DC_statement_form.pdf) or the revisions to approved plans form (http://reg.ucsc.edu/forms/DC_approval_revision.doc or http://reg.ucsc.edu/forms/DC_approval_revision.pdf).

This course is not expected to contribute to any major’s disciplinary communication requirement.

10. If you are requesting a GE designation for the proposed course, please justify your request making reference to the attached guidelines.

No General Education code is proposed for this course, as all relevant codes will have already been satisfied by the prerequisites.

11. If this is a new course and you requesting a new GE, do you think an old GE designation(s) is also appropriate? (CEP would like to maintain as many old GE offerings as is possible for the time being.)

No General Education code is proposed for this course, as all relevant codes (old or new) will have already been satisfied by the prerequisites.


Filed under: Circuits course, Pressure gauge Tagged: Arduino, bioengineering, capacitive touch sensor, circuits, course design, ECG, EKG, electret mic, electret microphone, electrocardiogram, electrodes, electronics, multimeter, op amp, oscilloscope, phototransistor, pressure sensor, sensors, teaching, thermistor