Posts with «capacitive touch sensor» label

Hysteresis board

Now that we’re using a 74HC14 Schmitt trigger in the capacitive touch sensor for the hysteresis oscillator, that lab can be the first soldering project, in addition to learning about hysteresis.

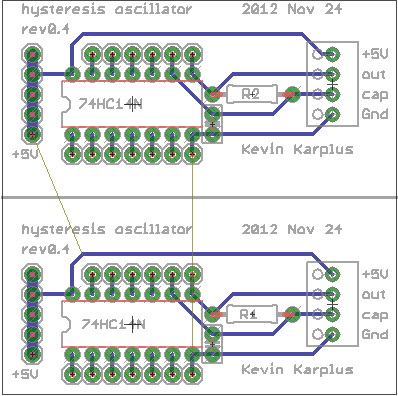
I tried laying out a very compact PC board for the students to solder (still requiring them to do some design—they’ll have to breadboard their design first to get appropriate R and C values). I came up with one very compact design that could get 4 copies into the 50mm×50mm limit of the $1 boards from ITEAD, making the boards only 25¢ each.

Compact layout to get 4 hysteresis oscillator boards out of one 50mm×50mm board. The gutters are pretty narrow, though, and I’m not sure I’m skillful enough with the board shears to cut that accurately.  The yellow “airwires” are Eagle telling me that the Gnd and +5V wires are not connected between the different copies.

It seemed a little silly to try to squeeze the price down to 25¢, when the other parts cost 90¢: 59¢ for the screw terminals, 28¢ for the Schmitt trigger chip, 1¢ for the resistor, and 2¢ for the capacitor. With this layout it is also a little tricky for the students to properly wire the unused inputs high.

Given the high risk of ruining the boards trying to cute them with the board shears, I decided to redesign for a 50¢ board.

Much looser layout, having only two copies on the 50mm x 50mm board. This version makes it easier for the students to see how things are connected, and has lots of room for the board shears to make the cut.

The lab would now require that the students measure the thresholds of the Schmitt trigger, breadboard the hysteresis oscillator, make a touch pad out of foil and packing tape, measure the frequency of the oscillation to estimate the touch pad capacitance, adjust the parameters of the Arduino program to match the frequencies of their oscillator, solder up the board, and demonstrate it working to control an LED. I think that is plenty for a 3-hour lab.

When I set up the web pages for the course, I’ll try to make sure I put the Eagle design files (.brd and .sch) for each board the students use on the web, so that future instructors can easily order more copies of the board, even if my laptop gets run over by a beer truck.  That will also make it easier for instructors at other schools to try to duplicate the course.


Filed under: Circuits course, Printed Circuit Boards Tagged: Arduino, bioengineering, capacitive touch sensor, circuits, course design, Printed circuit board, Schmitt trigger, sensors, teaching

Hysteresis lab

Schmitt-trigger oscillator.

Since I decided in Capacitive sensing with Schmitt trigger to use an off-the-shelf Schmitt trigger chip (like a 74HC14) and a very simple oscillator, I needed to rethink the lab and expand it.  Students will no longer be spending much time on building the circuit, so we need to play with other uses for the oscillator circuit and other applications of Schmitt triggers.

The Schmitt trigger is a useful device for students to learn about, since hysteresis is an important concept in detecting signals.  Probably the first thing to have them do is to use the oscilloscope in x-y mode to see the Vout vs. Vin curve for the Schmitt trigger inverter. It would be good for them to devise a way to measure the threshold voltages accurately (with their lab writeup describing both the method used and the thresholds measured), using the equipment they have available.  Perhaps bonus points for methods that don’t require any of the bench equipment? (There are some fairly easy methods using the Arduino for voltage measurements, though precision would be limited to about 5mV.)

After characterizing the inverter, they should design and measure one-inverter oscillators for different frequencies, using different combinations of resistors and capacitors (some low-resistance, high-capacitance designs and some high-resistance, low-capacitance designs).  They should show computations for the frequency using the threshold voltages and the R and C values.  It might be worthwhile to have them estimate the parasitic capacitance of the input to the Schmitt trigger (together with the wiring).

Then they should measure capacitance by hooking up an unknown capacitor with a known resistance, measuring the frequency, and computing the capacitance.  We would have to make up some unknowns with a wide range of different values.

Finally, they should make a capacitive touch pad (a piece of aluminum foil covered with a layer of packing tape). I’ve decided that I like foil covered with packing tape better than foil wrapped in plastic wrap.  The tape may be a bit thicker, but the lack of an air bubble makes for a much more repeatable capacitance, and it is less likely to fall apart when handled.

They should use the oscillator frequency to estimate the capacitance of both the plain pad and the pad when touched by a finger.  After observing the oscillator output on the oscilloscope they should adjust the parameters of a simple hysteresis program to turn an LED on and off with the touch sensor so that a firm touch is needed to light the LED and it doesn’t flicker with a light touch:

void setup(void)
{  pinMode(2,INPUT);
   pinMode(13,OUTPUT);
}

void loop(void)
{   digitalWrite(13, LOW);
    while (pulseIn(2,HIGH) <= 60) {}
    digitalWrite(13, HIGH);
    while (pulseIn(2,HIGH) >= 45) {}
}


Filed under: Circuits course Tagged: Arduino, bioengineering, capacitive touch sensor, circuits, course design, Schmitt trigger, sensors, teaching

Capacitive sensing with Schmitt trigger

Capacitive sensing with op amps and Capacitive sensing with op amps, continued used a rather complicated circuit to make a Schmitt-trigger oscillator out of op amps:

Modified circuit for longer period. C1 is just the stray capacitance of the touch sensor, with no deliberately added capacitance.

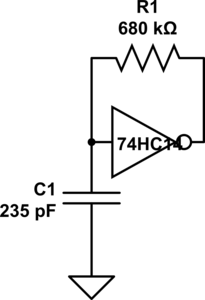
But if we use an off-the-shelf Schmitt trigger chip (like a 74HC14), then a very simple circuit can be made to oscillate:

Schmitt-trigger oscillator.

Without a touch sensor, it oscillates at about 10 kHz. With an untouched touch sensor, the frequency drops to about 9.5 kHz. With a touched sensor, the frequency drops further to around 6.7 kHz. I can make the touch sensor have a bigger relative frequency change by reducing the capacitor to 157pF (3 470pF in series), from 15kHz down to 8kHz. This oscillator works fine with the code I wrote for the op-amp oscillator. Neither the resistor nor the capacitor values are particularly critical (as long as the addition of about 140pF from the touch drops the frequency enough to be measurable).

The Schmitt trigger is a useful device for students to learn about, since hysteresis is an important concept in detecting signals. In fact, it might not be a bad idea to have the code that detects the frequency and turns the LED on or off have some hysteresis, as code that just uses a time-out for debouncing tends to make the LED flash on and off when a near-touch is done.

This circuit is too simple for a full 3-hour lab. It can be wired in a couple of minutes and tested in a few more. I’ll have to think of other things to do with a Schmitt trigger to make this into a full lab.  Perhaps this could be an Arduino programming lab, where they start with just a simple pulseIn program and make some modifications:

void setup(void)
{  pinMode(2,INPUT);
   pinMode(13,OUTPUT);
}

void loop(void)
{
    uint8_t on = (pulseIn(2,HIGH) >= 50) ;
    digitalWrite(13, on);
}

Perhaps a simple hysteresis program:

void setup(void)
{  pinMode(2,INPUT);
   pinMode(13,OUTPUT);
}

void loop(void)
{   digitalWrite(13, LOW);
    while (pulseIn(2,HIGH) <= 50) {}
    digitalWrite(13, HIGH);
    while (pulseIn(2,HIGH) >= 40) {}
}

Students would have to measure their oscillator waveforms on the oscilloscope, then play with the constants in the code to get reliable switching. It’s still not a 3-hour lab, but it gives another view of hysteresis.

I’ll have to think about this some more.


Filed under: Circuits course Tagged: Arduino, bioengineering, capacitive touch sensor, circuits, course design, op amp, Schmitt trigger, sensors, teaching

Supplemental sheet for lab, draft 1

In my previous post, I said that I would post drafts of my supplemental sheets describing the course here on my blog, to get feedback before submitting them. Since I’ve been thinking more about the labs than the lectures, I’ll try writing the sheet for the lab first. It will be based, in part, on my prior list of lab topics, somewhat updated.

Undergraduate Supplemental Sheet
Information to accompany Request for Course Approval
Sponsoring Agency Electrical Engineering
Course #
102L (I need to get a number from the department that they are not currently using. Since we are planning the course as an alternative prerequisite to EE 104 in place of EE101+L, I think that 102 would be a good number, with the L suffix for the lab course.)
Catalog Title
Applied Circuits Lab

Please answer all of the following questions using a separate sheet for your response.
1. Are you proposing a revision to an existing course? If so give the name, number, and GE designations (if applicable) currently held.

This is not a revision to any existing course.

2. In concrete, substantive terms explain how the course will proceed. List the major topics to be covered, preferably by week.

  1. Thermistor lab
    The lab will start with having students learn about the test equipment by having them use the multimeters to measure other multimeters. What is the resistance of a multimeter that is measuring voltage? of one that is measuring current? what current or voltage is used for the resistance measurement? The first lab will then have three parts, all involving the use of a Vishay BC Components NTCLE413E2103F520L thermistor or equivalent.

    First, the students will use a bench multimeter to measure the resistance of the thermistor, dunking it in various water baths (with thermometers in them to measure the temperature). They should fit a simple curve to this data (warning: temperature needs to be on an absolute scale).

    Second, they will add a series resistor to make a voltage divider. They have to choose a value to get as large and linear a voltage response as possible at some specified “most-interesting” temperature (perhaps body temperature, perhaps room temperature, perhaps DNA melting temperature). There will be a pre-lab exercise where they derive the formula for maximizing . They will then measure and plot the voltage output for the same set of water baths. If they do it right, they should get a much more linear response than for their resistance measurements.

    Finally, they will hook up the voltage divider to an Arduino analog input and record a time series of a water bath cooling off (perhaps adding an ice cube to warm water to get a fast temperature change), and plot temperature as a function of time.EE concepts needed: voltage, resistance, voltage divider, notion of a transducer.

    Lab skills developed: use of multimeter for measuring resistance and voltage, use of Arduino with data-acquisition program to record a time series, fitting a model to data points, simple breadboarding.

    Equipment needed: multimeter, power supply, thermistor, selection of various resistors, breadboard, clip leads, thermoses for water baths, secondary containment tubs to avoid water spills in the electronics lab. Arduino boards will be part of the student-purchased lab kit (separate from rest of kit, so that students can use Arduinos previously purchased). All uses of the Arduino board assume connection via USB cable to a desktop or laptop computer that has the data logger software that we will provide.

  2. Electret microphone

    First, we will have the students measure and plot the DC current vs. voltage for the microphone. The microphone is normally operated with a 3V drop across it, but can stand up to 10V, so they should be able to set the Agilent E3631A power supply to various values from 0V to 10V and get the voltage and current readings directly from the bench supply, which has 4-place accuracy for both voltage and current. There is some danger of the students accidentally delivering too much voltage and frying the mic, but as long as they get the polarity right, that isn’t too big a hazard. Ideally, they should see that the current is nearly constant as voltage is varied—nothing like a resistor.

    Second, we will have them do current-to-voltage conversion with a 5v power supply to get a 2.5v DC output from the microphone and hook up the output of the microphone to the input of the oscilloscope. Input can be whistling, talking, iPod earpiece, … . They should learn the difference between AC-coupled and DC-coupled inputs to the scope, and how to set the horizontal and vertical scales of the scope.

    Third, we will have them design and wire their own DC blocking RC filter (going down to about 1Hz), and confirm that it has a similar effect to the AC coupling on the scope.

    Fourth, they will play sine waves from the function generator through a loudspeaker next to the mic, observe the voltage output with the scope, and measure the voltage with a multimeter, plotting output voltage as a function of frequency. Note: the specs for the electret mic show a fairly flat response from 50Hz to 3kHz, so most of what the students will see here is the poor response of a cheap speaker at low frequencies.

    Those with extra time could look at putting the speaker and mic at opposite ends of tube and seeing what difference that makes.EE concepts: current sources, AC vs DC, DC blocking by capacitors, RC time constant, sine waves, RMS voltage, properties varying with frequency.

    Lab skills: power supply, oscilloscope, function generator, RMS AC voltage measurement.

    Equipment needed: multimeter, oscilloscope, function generator, power supply, electret microphone, small loudspeaker, selection of various resistors, breadboard, clip leads.

  3. Electrode measurements

    First, we will have the students attempt to measure the resistance of a saline solution using a pair of stainless steel electrodes and a multimeter. This should fail, as the multimeter gradually charges the capacitance of the electrode/electrolyte interface.

    Second, the students will use a voltage divider, with 10–100Ω load resistor and the function generator driving the voltage divider. The students will measure the RMS voltage across the resistor and across the electrodes for different frequencies from 3Hz to 300kHz (the range of the AC measurements for the Agilent 34401A Multimeter). They will plot the magnitude of the impedance of the electrodes as a function of frequency and fit an R2+(R1||C1) model to the data. A little hand tweaking of parameters should help them understand what each parameter changes about the curve.

    Third, the students will repeat the measurements and fits for different concentrations of NaCl, from 0.01M to 1M. Seeing what parameters change a lot and what parameters change only slightly should help them understand the physical basis for the electrical model.

    Fourth, students will make Ag/AgCl electrodes from fine silver wire. The two standard methods for this involve either soaking in chlorine bleach or electroplating. To reduce chemical hazards, we will use the electroplating method. Students will calculate the area of their electrodes and the recommended electroplating current, and adjust the bench supplies to get the desired current.

    Fifth, the students will measure and plot the resistance of a pair of Ag/AgCl electrodes as a function of frequency (as with the stainless steel electrodes).

    Sixth, if there is time, students will measure the potential between a stainless steel electrode and an Ag/AgCl electrode.EE concepts:magnitude of impedance, series and parallel circuits, variation of parameters with frequency, limitations of R+(C||R) model.

    Electrochemistry concepts: At least a vague understanding of half-cell potentials. Ag → Ag+ + e-, Ag+ + Cl- → AgCl, Fe + 2 Cl-→ FeCl2 + 2 e-.

    Lab skills: bench power supply, function generator, multimeter, fitting functions of complex numbers, handling liquids in proximity of electronic equipment.

    Equipment needed: multimeter, function generator, power supply, stainless steel electrode pairs, silver wires, frame for mounting silver wire, resistor, breadboard, clip leads, NaCl solutions in different concentrations, beakers for salt water, secondary containment tubs to avoid salt water spills in the electronics lab.

  4. Sampling and Aliasing

    Students will use a PC board that samples and digitizes an input with an 8-bit ADC, then reconstructs the waveform with a DAC. An existing lab has been used in other EE courses for explaining and demonstrating aliasing of sampled signals using this board, a signal generator, and a dual-trace oscilloscope. Note: this is a student-executed demo, rather than a design or measurement lab.EE concepts: quantized time, quantized voltage, sampling frequency, Nyquist frequency, aliasing.

    Lab skills: dual traces on oscilloscope.Equipment needed: ADC/DAC board, dual-trace oscilloscope, function generator.

  5. Audio amplifier

    Students will use an op amp to build a simple non-inverting audio amplifier for an electret microphone, setting the gain to around 6 or 7. Note that we are using single-power-supply op amps, so they will have to design a bias voltage supply as well.If this lab is too short, then students could feed the output of the amplifier into an analog input of the Arduino and record the waveform at the highest sampling rate they can with the software we provide (probably around 300–500 Hz). This would again demonstrate aliasing.EE concepts: op amp, DC bias, bias source with unity-gain amplifier, AC coupling, gain computation.

    Lab skills: complicated breadboarding (enough wires to have problems with messy wiring). If we add the Arduino recording, we could get into interesting problems with buffer overrun if their sampling rate is higher than the Arduino’s USB link can handle.

    Equipment needed: breadboard, op amp chip, assorted resistors and capacitors, electret microphone, Arduino board, optional loudspeaker.

  6. Capacitive touch sensor

    The students will build an op-amp oscillator (a square-wave one, not a sine wave) whose frequency is dependent on the parasitic capacitance of a touch plate, which the students can make from Al foil and plastic food wrap. Students will have to measure the frequency of the oscillator with and without the plate being touched.

    Instead of breadboarding, students will wire this circuit by soldering wires and components on a PC board designed for prototyping op amp and instrumentation amp circuits.
    We will also provide a simple Arduino program that is sensitive to changes in the period of the oscillator and turns an LED on or off, to turn the frequency change into an on/off switch.EE concepts: frequency-dependent feedback, oscillator, RC time constants, parallel capacitors.

    Lab skills: soldering. Frequency measurement with multimeter.

    Equipment needed: Power supply, multimeter, Arduino, clip leads, amplifier prototyping board, oscilloscope.

  7. Phototransistor

    The details of this lab have not been worked out yet. It will probably involve either making a photointerrupter switch or making and characterizing an optoisolater made from an infrared LED and a phototransistor.EE concepts: LEDs and phototransistors (maybe also photodiodes and photoresistors), optoisolators.

    Equipment needed: breadboard, LED, phototransistor, resistors, function generator, oscilloscope, multimeter.

  8. Pressure sensor 1—instrumentation amplifier

    Students will design an instrumentation amplifier with a gain of 300 or 500 to amplify the differential strain-gauge signal from a medical-grade pressure sensor (the Freescale MPX2300DT1), to make a signal large enough to be read with the Arduino A/D converter. The circuit will be soldered on the instrumentation amp/op amp protoboard.The sensor calibration will be checked with water depth in a small reservoir. Note: the pressure sensor comes in a package that exposes the wire bonds and is too delicate for student assembly by novice solderers. We will make a sensor module that protects the sensor and mounts the sensor side to a 3/4″ PVC male-threaded plug, so that it can be easily incorporated into a reservoir, and mounts the electronic side on a PC board with screw terminals for connecting to student circuits.

    EE concepts: differential signals, twisted-pair wiring, strain gauge bridges, instrumentation amplifier, DC coupling, gain.

    Equipment needed: Power supply, amplifier prototyping board, oscilloscope, pressure sensor mounted in PVC plug with breakout board for easy connection, water reservoir made of PVC pipe, secondary containment tub to avoid water spills in electronics lab.

  9. Pressure sensor 2—modeling fluidics with linear circuits
    Students will use the pressure sensors and amplifiers from the previous labs to characterize a pair of water reservoirs connected by a flexible hose. The details of the lab are still being worked out.Students will either induce a step change in pressure in one reservoir and record the step response in each reservoir, or will mount one reservoir on a homemade shaker table driven by a function generator and an audio amplifier.EE concepts: hydraulic analogy, frequency response (both amplitude and phase).

    Equipment needed: Power supply, amplifier prototyping board, oscilloscope, Arduino, pressure sensor mounted in PVC plug with breakout board for easy connection, 2 water reservoirs made of PVC pipe, hose connections, secondary containment tub to avoid water spills in electronics lab, possibly home-made shaker table. Note: the shaker table and power amplifier is the most expensive piece of equipment not already in the lab: it will cost about $50 to build.

  10. Electrocardiogram EKG

    Students will design and solder an instrumentation amplifier with a gain of 2000 and bandpass of about 0.1Hz to 100Hz. The amplifier will be used with 3 disposable EKG electrodes to display EKG signals on the oscilloscope and record them on the Arduino.Equipment needed: Instrumentation amplifier protoboard, EKG electrodes, alligator clips, Arduino, oscilloscope.

3. Systemwide Senate Regulation 760 specifies that 1 academic credit corresponds to 3 hours of work per week for the student in a 10-week quarter. Please briefly explain how the course will lead to sufficient work with reference to e.g., lectures, sections, amount of homework, field trips, etc. [Please note that if significant changes are proposed to the format of the course after its initial approval, you will need to submit new course approval paperwork to answer this question in light of the new course format.]

This is a 2-unit course. Three hours a week will be spent in scheduled labs, another 3 hours a week in pre-lab design activity and post-lab write-ups.

4. Include a complete reading list or its equivalent in other media.

Wikipedia book: http://en.wikipedia.org/wiki/User:Kevin_k/Books/applied_circuits
Because no existing textbook covers all the material of the course, collection of relevant Wikipedia articles has been made that covers all the major topics. The book is available online for free, but students can purchase a printed and bound version (about 350 pages), if they want. Some of the Wikipedia articles contain more detail than is needed for the course, but about 90% of the content is relevant and will be required.

Data sheets: Students will be required to find and read data sheets for each of the components that they use in the lab.

Op amps for everyone by Ron Mancini http://www.e-booksdirectory.com/details.php?ebook=1469 Chapters 1–6 This free book duplicates some of the material in the Wikipedia book, but provides more detail and a cleaner presentation of some of the op-amp material.

Op Amp Applications Handbook by Analog Devices http://www.analog.com/library/analogDialogue/archives/39-05/op_amp_applications_handbook.html has some useful material, particularly in Sections 1-1 and 1-4, but is generally too advanced for a first circuits course. Readings in this book will be optional for the more advanced students.

The classic book The Art of Electronics by Horowitz and Hill has one of the best presentations of op amps in Chapter 4. Chapters 1 and 4, and parts of Chapters 5 and 7 are relevant to this course. Unfortunately, the book is now 23 years old and much of the description of specific chips is obsolete, but the book is still quite expensive. We will provide page and section numbers for optional readings in this book that correspond to the readings in the main texts, but not require this book.

5. State the basis on which evaluation of individual students’ achievements in this course will be made by the instructor (e.g., class participation, examinations, papers, projects).

Students will be evaluated on in-lab demonstrations of skills and on the lab write-ups.

6. List other UCSC courses covering similar material, if known.

EE 101L covers some of the same basic electronic lab skills, but without the focus on sensors or design, and without instrumentation amps.

Physics 160 offers a similar level of practical electronics, but focuses on physics applications, rather than on bioengineering applications, and is only offered in alternate years.

7. List expected resource requirements including course support and specialized facilities or equipment for divisional review. (This information must also be reported to the scheduling office each quarter the course is offered.)

The course will need the equipment of a standard analog electronics teaching lab: power supply, multimeter, function generator,  oscilloscope, and computer plus soldering irons. The equipment in Baskin Engineering 150 (used for EE 101L) is ideally suited for this lab. There are 24 stations in the lab, but only 12 function generators. Adding a dozen $300 function generators would make all 24 stations simultaneously usable, but the lab could be run with only half the stations, if all labs requiring function generators are done only with student pairs rather than individuals.

In addition, a few special-purpose setups will be needed for some of the labs. The special-purpose equipment was designed to be easily constructed with simple tools and to cost around $50/setup. One of the teachers is prototyping all the lab setups at home, to make sure that they can be effectively made within budget without expensive parts or much shop time.

There are a number of consumable parts used for the labs (integrated circuits, resistors, capacitors, PC boards, wire, and so forth), but these are easily covered by standard School of Engineering lab fees.

The course requires a faculty member (simultaneously teaching the co-requisite Applied Circuits course) and a teaching assistant (for providing help in the labs and for evaluating student lab demonstrations).

8. If applicable, justify any pre-requisites or enrollment restrictions proposed for this course. For pre-requisites sponsored by other departments/programs, please provide evidence of consultation.

Students will be required to have single-variable calculus and a physics electricity and magnetism course. Both are standard prerequisites for any circuits course. Although DC circuits can be analyzed without calculus, differentiation and integration are fundamental to AC analysis. Students should have already been introduced to the ideas of capacitors and inductors.

9. Proposals for new or revised Disciplinary Communication courses will be considered within the context of the approved DC plan for the relevant major(s). If applicable, please complete and submit the new proposal form (http://reg.ucsc.edu/forms/DC_statement_form.doc or http://reg.ucsc.edu/forms/DC_statement_form.pdf) or the revisions to approved plans form (http://reg.ucsc.edu/forms/DC_approval_revision.doc or http://reg.ucsc.edu/forms/DC_approval_revision.pdf).

This course is not expected to contribute to any major’s disciplinary communication requirement.

10. If you are requesting a GE designation for the proposed course, please justify your request making reference to the attached guidelines.

No General Education code is proposed for this course, as all relevant codes will have already been satisfied by the prerequisites.

11. If this is a new course and you requesting a new GE, do you think an old GE designation(s) is also appropriate? (CEP would like to maintain as many old GE offerings as is possible for the time being.)

No General Education code is proposed for this course, as all relevant codes (old or new) will have already been satisfied by the prerequisites.


Filed under: Circuits course, Pressure gauge Tagged: Arduino, bioengineering, capacitive touch sensor, circuits, course design, ECG, EKG, electret mic, electret microphone, electrocardiogram, electrodes, electronics, multimeter, op amp, oscilloscope, phototransistor, pressure sensor, sensors, teaching, thermistor

Order and topics for labs

I had a good discussion with Steve P. this afternoon about the order and purpose of the labs I’ve designed so far.  He’ll be putting together a list of EE topics we have to cover to coordinate with the labs, so that students will have enough theory to do each lab, but not be overwhelmed with theory that they don’t yet have a use for.

I’ve designed the labs mainly around the interests of bioengineering majors, but I’ve tried to keep in mind other possible students, such as Digital Arts and New Media students, who would be interested in practical sensor circuits for interfacing to art projects (particularly for inputs to Arduino microprocessors).

Lab 1: thermistor

See posts

  1. More musings on circuits course: temperature lab
  2. Temperature lab, part2
  3. Temperature lab, part 3: voltage divider

The first lab will consist of 3 parts, all involving the use of a Vishay BC Components NTCLE413E2103F520L thermistor.

First, the students would use a bench multimeter to measure the resistance of the thermistor, dunking it in various water baths (with thermometers in them to measure the temperature).  They should fit a simple curve to this data (warning: temperature needs to be on an absolute scale).

Second, they would add a series resistor to make a voltage divider. They have to choose a value to get as large and linear a voltage response as possible at some specified “most-interesting” temperature (perhaps body temperature, perhaps room temperature, perhaps DNA melting temperature).  There should probably be a pre-lab exercise where they derive the formula for maximizing . They would then measure and plot the voltage output for the same set of water baths. If they do it right, they should get a much more linear response than for their resistance measurements.

Finally, they would hook up the voltage divider to an Arduino analog input and record a time series of a water bath cooling off (perhaps adding an ice cube to warm water to get a fast temperature change), and plot temperature as a function of time.

EE concepts needed: voltage, resistance, voltage divider, notion of a transducer.

Lab skills developed: use of multimeter for measuring resistance and voltage, use of Arduino with data-acquisition program to record a time series, fitting a model to data points, simple breadboarding.

Note:  Mylène suggested that we start student familiarization with the test equipment by having them use the multimeters to measure other multimeters.  What is the resistance of a multimeter that is measuring voltage?  of one that is measuring current? what current or voltage is used for the resistance measurement?  We might want to do this first.

 Lab 2: electret microphone

See posts

  1. Oscilloscope practice lab
  2. Op-amp lab

Mylène suggested that we start oscilloscope familiarity by looking at the output of power supplies. What ripple can you see on the voltage output of a benchtop supply? of a cheap wall wart?  This requires the students to learn the difference between DC and AC input coupling for oscilloscopes.  I think that we may be able to teach what we need here without measuring the power supplies, though that is a good backup plan.

First, we would have the students measure and plot the DC current vs. voltage for the microphone.  The microphone is normally operated with a 3V drop across it, but can stand up to 10V, so they should be able to set the Agilent E3631A power supply to various values from 0V to 10V and get the voltage and current readings directly from the bench supply, which has 4-place accuracy for both voltage and current.  There is some danger of the students accidentally delivering too much voltage and frying the mic, but as long as they get the polarity right, that isn’t too big a hazard.  Ideally, they should see that the current is nearly constant as voltage is varied—nothing like a resistor.

Second, we would have them do current-to-voltage conversion with a 5v power supply to get a 2.5v DC output and hook up the output of the microphone to the input of the oscilloscope.  Input can be whistling, talking, iPod earpiece, … . They should learn the difference between AC coupled and DC coupled inputs to the scope, and how to set the horizontal and vertical scales of the scope.

Third, we would have them design and wire their own DC blocking filter (going down to about 1Hz), and confirm that it has a similar effect to the AC coupling on the scope.

Fourth, they should play sine waves from the function generator through a loudspeaker next to the mic, observe the voltage output with the scope, and measure the voltage with a multimeter, plotting output voltage as a function of frequency.  Note: the specs for the electret mic show a fairly flat response from 50Hz to 3kHz, so most of what the students will see here is the poor response of a cheap speaker at low frequencies.  Those with extra time could look at putting the speaker and mic at opposite ends of tube and seeing what difference that makes.

EE concepts: current sources, AC vs DC, DC blocking by capacitors, RC time constant, sine waves, RMS voltage, properties varying with frequency.

Lab skills: power supply, oscilloscope, function generator, RMS AC voltage measurement.

Lab 3: electrode measurements

See posts

  1. Trying to measure ionic current through small holes
  2. Conductivity of saline solution
  3. On stainless steel
  4. Better measurement of conductivity of saline solution
  5. Measuring Ag/AgCl electrodes

First, we would have the students attempt to measure the resistance of a saline solution using a pair of stainless steel electrodes and a multimeter.  This should fail, as the multimeter gradually charges the capacitance of the electrode/electrolyte interface.  For the safety of the lab equipment, we should have the beakers with salt water in a secondary containment tray at all times.

Second, the students should again use a voltage divider, with 10–100Ω load resistor, but with the function generator driving the voltage divider.  The students should measure the RMS voltage across the resistor and across the electrodes for different frequencies from 3Hz to 300kHz (the range of the AC measurements for the Agilent 34401A Multimeter).  They should plot the magnitude of the impedance of the electrodes as a function of frequency and fit an R2+(R1||C1) model to the data.  A little hand tweaking of parameters should help them understand what each parameter changes about the curve.

Third, the students should repeat the measurements and fits for different concentrations of NaCl (we’ll have to get a liter or so of each stock solution made up by one of the wet labs).  Seeing what parameters change a lot and what parameters change only slightly should help them understand the physical basis for the electrical model.

Fourth, students should make Ag/AgCl electrodes from fine silver wire. To avoid possible problems with Clorox in the lab, we’ll probably have them electroplate in NaCl solutions.  If their electrodes have an area of about 0.8 cm2 (2.5cm of 18 gauge wire with a diameter of 1.024mm), we can electroplate at the recommended current density of 1mA/cm2 (so 0.8mA) in 0.9% (0.16M) NaCl for a minute, reversing polarity occasionally to improve the chloride coat. The instructions I’ve seen vary a lot, so neither the salt concentration nor the current density seem to be particularly critical values. We could provide a constant-current supply, but we can probably get by with just having them use a bench supply and adjust the voltage manually to keep the current around 1mA, using visual feedback to terminate the process. (Some instructions just call for using a 9v battery and a whole coil of silver wire.)  According to Warner Instruments

The color of a well plated electrode will be light gray to a purplish gray. While plating, occasionally reversing the polarity for several seconds tends to deepen the chloride coating and yield a more stable electrode.

Fifth, the students should measure and plot the resistance of a pair of Ag/AgCl electrodes as a function of frequency (as with the stainless steel electrodes). We’ll have to think of an easy way for them to mount their electrodes so that they don’t move and so that the silver-copper interface is not near the salt water.

Sixth, if there is time, measuring the potential between a stainless steel electrode and an Ag/AgCl electrode.

EE concepts: impedance, series and parallel circuits, variation of parameters with frequency.

Electrochemistry concepts: At least a vague understanding of half-cell potentials. Ag → Ag+ + e-,  Ag+ + Cl- → AgCl.

Lab skills: bench power supply, function generator, multimeter, fitting functions of complex numbers, handling liquids in proximity of electronic equipment.

Lab 4: Sampling and aliasing

I don’t know the details of this lab, but Steve P. has a PC board that samples and digitizes an input with an 8-bit ADC, then reconstructs the waveform with a DAC.  He has worked out a lab for explaining and demonstrating aliasing of sampled signals using this board, a signal generator, and a dual-trace oscilloscope.  I’ll have to borrow the board and the lab handout from him to see if there is anything in the lab I’d want to tweak.

EE concepts: quantized time, quantized voltage, sampling frequency, Nyquist frequency, aliasing.

Lab skills: dual traces on oscilloscope.

Lab 5: Op amp basics

See post Op-amp lab

Use an op amp to build a simple non-inverting audio amplifier for an electret microphone, setting the gain to around 6 or 7.  Note that we are using single-power-supply op amps.

If this lab is too short, then students could feed the output of the amplifier into an analog input of the Arduino and record the waveform at the highest sampling rate they can with the software we provide (probably around 300–500 Hz).  This would again demonstrate aliasing.

EE concepts: op amp, DC bias, bias source with unity-gain amplifier, AC coupling, gain computation.

Lab skills: complicated breadboarding (enough wires to have problems with messy wiring). If we add the Arduino recording, we could get into interesting problems with buffer overrun if their sampling rate is higher than the Arduino’s USB link can handle.

Lab 6: capacitive touch sensor

See posts

  1. Capacitive sensing
  2. Capacitive sensing, part 2
  3. Capacitive sensing with op amps
  4. Capacitive sensing with op amps, continued

The students would build an op-amp oscillator (a square-wave one, not a sine wave) whose frequency is dependent on the parasitic capacitance of a touch plate, which the students can make from Al foil and plastic food wrap. Students would have to measure the frequency of the oscillator with and without the plate being touched.

We can provide a simple Arduino program that is sensitive to changes in the period of the oscillator (see example in Capacitive sensing with op amps, continued) and turns an LED on or off.

EE concepts: frequency-dependent feedback, oscillator, RC time constants, parallel capacitors.

Lab skills: more messy breadboarding.  Frequency measurement.

Lab 7: Phototransistor

See posts

  1. Phototransistor
  2. Synchronous demodulator
  3. Pulse detection with light
  4. Giving up on light-based pulse sensor
  5. Looking at bioengineering measurements courses
  6. Random thoughts on circuits labs

Since optical detection is such an important part of many biomolecular lab techniques, I really want to do something with an LED and phototransistor (or CdS cell or photodiode), but so far none of my ideas have worked out.  I have a nice Fairchild QRE1113 reflectance sensor that uses a matched 940nm wavelength LED and phototransistor, which I’ve used a tachometer for motors for the robotics club. Unfortunately, a tachometer is more appropriate for a mechatronics lab than a biengineering circuits course.

I thought that I might be able to use it to measure arterial pulses by reflection, but I don’t seem to get a signal at my heart rate (I did better with the uncomfortable ear clip).

The reflectance sensor is good for measuring finger tremor if you hold a finger close to (but not touching) the sensor.  The effect is optical, not capacitive coupling, since the signal is stronger if a non-conducting white piece of paper is held near the sensor rather than a finger.  The reflectance sensor is remarkably insensitive to ambient light, though shining a laser pointer on the sensor is easily detected.

We can easily do labs involving interrupting light beams, but there isn’t much “circuit” stuff for the simple ones and not much “bio” stuff either.  We could up the circuit content (perhaps too much) by modulating the light beam and using a synchronous demodulator to detect the beam even in the presence of high ambient light.

I still need to find something that is feasible and somehow related to bioengineering.  This needs more thought.

Lab 8: No idea

I’m still missing a lab.  I’ve not done anything with position, pressure, or volume sensing yet.  Of course, it is possible that some of the earlier labs will take longer than I think, and we’ll need to slip the schedule anyway.  The EKG lab looks pretty packed, so may be some portion of that could be foreshadowed here.  Perhaps bandpass filtering and characterizing a simple filter?  That would be useful, but rather boring.

Maybe an electronic music lab of some sort would be fun here?

Labs 9 and 10: EKG

See posts

  1. EMG and EKG works
  2. Two-stage EKG
  3. EKG recording working
  4. More thoughts on EKG
  5. EKG blinky
  6. Instrumentation amp protoboard
  7. Instrumentation amp protoboard rev2.1
  8. EKG blinky boards arrived

The electrocardiogram will be the final project for the course, and I think it will take two full lab sessions. The first lab session would consist of soldering up the instrumentation amp protoboard, checking for opens and shorts, and designing and characterizing a differential amplifier with an adjustable gain of about 100–1000 (including AC coupling to eliminate problems with DC offset saturating later stages).  The amplifier should have a bandwidth of about 0.01Hz–150Hz.

The second one would be and making a twisted-wire harness with alligator clips to attach to the EKG electrodes, connecting the amplifier to the electrodes, debugging the student-designed EKG amplifiers, and adjusting the gain.  I suspect that a few students will get a design that works in the first week, but that a lot of students will be doing a lot of unsoldering and resoldering as they find bugs in their design, hence the need for 2 weeks in the lab.

Student check out will require that they be able to blink an LED in time with their heart beat, display the EKG waveform on the oscilloscope, and record a minute of EKG signal at 200 samples/second using the Arduino, all without adjusting their board between demos.

EE concepts: biopotentials, instrumentation amplifier, common-mode signal, differential signal, twisted pair wiring, grounding to avoid common-mode signal saturating an instrumentation amplifier, Ac coupling, simple bandpass filtering.

Lab skills: soldering.

Summary

I have a pretty clear idea how I think the lab part of the course should start and how it should end, but there are a couple of weeks just before the end that are still a bit vague.  Perhaps as Steve starts aligning the EE topics with the labs he can identify some topics that need a lab exercise to clarify them.  Maybe some of my blog readers (those who haven’t deserted me during this long process of designing a course) can make some more suggestions—even repeating some old suggestions would not be a bad idea now, as I need a creative kick.


Filed under: Circuits course, Data acquisition Tagged: Arduino, bioengineering, capacitive touch sensor, circuits, course design, ECG, EKG, electret mic, electret microphone, electrocardiogram, electrodes, electronics, multimeter, op amp, oscilloscope, phototransistor, sensors, teaching, thermistor

Capacitive sensing with op amps, continued

What more can I do (or, more importantly, have the students do with the Capacitive sensing with op amps?

The circuit that I gave in that post has several parameters.  Perhaps the students should try predicting what happens when they are adjusted.

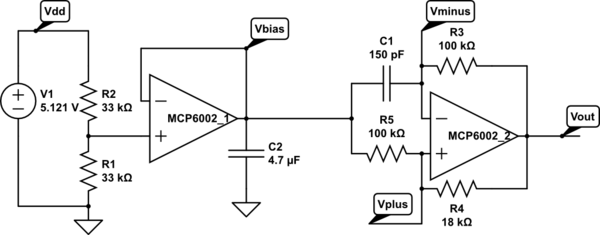
Op amp multivibrator. The first op amp is just to set up a virtual ground halfway between the power rails. The second op amp does the oscillating (at about 8.12 kHz for these components). Circuit drawn with CircuitLab, which is not capable of simulating it.

For example, what happens if Vbias is raised or lowered? What is the effect of changing each of the resistors? How can we optimize the circuit for easy, reliable detection of touches with an Arduino pulseIn() measurement?

If we pretend that the output is a rail-to-rail square wave (ignoring the slew rate limitation), analysis is pretty easy.

.

  • If the output is low, then and Vminus is higher than that, but dropping.
  • If the output is high, then and Vminus is lower than that, but rising.

If we define , we can simplify further and say that Vminus swings between two threshold voltages:   and .

The discharging curve is simply , where , so it takes to discharge to the other threshold.

The charging curve is , and so it takes . That is, .

If we want a symmetric waveform, we need to have , which in turn requires . Raising Vbias makes the low part of the output waveform shorter and the high part longer. Conversely, lowering Vbias makes the low part longer and the high part shorter.

The total period is  .  If we set Vbias to Vdd/2, then we can simplify further to .

The sum R4+R5 only affects the amount of current that the Vbias supply has to provide, but it is probably a good idea to make it fairly large, and to add a bypass capacitor to Vbias, to prevent noise coupling though the bias supply.

When using pulseIn() on the Arduino to measure the capacitance C1, we want to have a large change in the pulse duration (to avoid quantization effects from reporting the duration in μsec), which means a large value for R3. That is limited by the problem of picking up 60Hz noise if the input impedance is too high.

We can also tweak r=R5/R4 a little, to make the period a larger multiple of τ, limited by the problem of noise if we get the thresholds too close to the rails.

Since pulseIn() only measures one part of the waveform (the low part or the high part), we could also tweak the bias voltage to lengthen just that part of the waveform, for example, dropping Vbias to Vdd/4 to length the low part.  We again have to be careful not to get the threshold too close to the rails.  If we are lowering Vbias, then the threshold to watch is . If we fix as low as we’re willing to make it, then should we make Vbias low or r high?  The number we are trying to maximize is the discharge time , with the constraint that . At equality, we have to maximize , which is achieved by making r as large as possible.  Of course, that would mean raising Vbias, which would run us into trouble with noise at the other threshold.  In general, it seems like the symmetric waveform with Vbias=Vdd/2 gives us the best noise margins.

Next step: how do we either slow down the oscillator or clean up the waveform enough to get a good signal to feed into the Arduino?

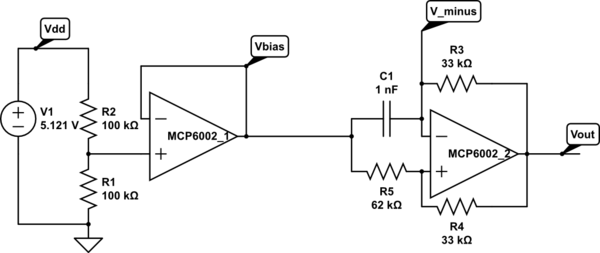
I tried increasing both R1 and R5, while decreasing R4, as shown below.

Modified circuit for longer period. C1 is just the stray capacitance of the touch sensor, with no deliberately added capacitance.

This circuit oscillates with a frequency of 35.66 kHz (period of about 28 µsec )when the touch sensor is not touched, which is slow enough that the signal runs from rail to rail. Touching the sensor drops the frequency to 20kHz or less (period of 50 µsec or more). Since r=5.556, the expected period is 4.988 τ, or 0.4988 µsec/pF C1.  The period is consistent with a stray capacitance of 56 pF, increasing to over 100 pF when the sensor is touched.  There is a lot of jitter in the lower-frequency signal, probably due to some coupling of 60 Hz noise into the system. A 1nF capacitor for C1 gives a frequency of 1660Hz (602 µsec, which is more than the expected 500 µsec), 47nF gives 34.65 Hz (28.86 msec, not the expected 23.44 msec).  Why am I consistently 25% off?

The change of 20 µsec or more in the period (10 µsec or more in the half period) should be easily detectable with one pulseIn() measurement on the Arduino.  The following code seems to work fairly well, with a light touch causing the LED to flash (right on the edge of detection) and a firmer touch giving a steady reading.

// Capacitive sensor switch
// Thu Jul 12 21:36:42 PDT 2012 Kevin Karplus

// To use, connect the output of the op-amp oscillator to
// pin CAP_PIN on the Arduino.
// The code turns on the LED on pin 13 when a touch is sensed.

// The Arduino measures the width of one LOW pulse on pin CAP_PIN.
// The LED is turned on if the pulse width is more than min_pulse_usec

// pin that oscillator output connected to
#define CAP_PIN (2)

// time (in milliseconds) to wait after a change in state before
// testing input again
#define DEBOUNCE_MSEC (100)

static uint8_t was_on;	// stored state of LED, for detecting transition

static uint16_t min_pulse_usec=5;
// min pulse width (in  microseconds) for detecting a touch

void setup(void)
{
    was_on=0;
    pinMode(CAP_PIN,INPUT);
    pinMode(13, OUTPUT);
    
    // assuming that the touch sensor is not touched when resetting, 
    // find the maximum typical value for untouched sensor
    for (uint8_t i=0; i<10; i++)
    {   long pulse=pulseIn(CAP_PIN,LOW);
        if (pulse>min_pulse_usec)
	{    min_pulse_usec =pulse;
	}
    }
    min_pulse_usec += 2;	// add some room for noise
}

void loop(void)
{
    uint8_t on = pulseIn(CAP_PIN,LOW) >= min_pulse_usec;
    digitalWrite(13, on);
    if (on!=was_on)
    {   delay(DEBOUNCE_MSEC);
        was_on=on;       
    }
}


Filed under: Circuits course Tagged: Arduino, bioengineering, capacitive touch sensor, circuits, course design, op amp, sensors, teaching

Capacitive sensing with op amps

I’m not very happy with the lab exercise in Capacitive sensing.  The basic design questions are good:

  • What capacitance do we add by touching something?
  • What frequency should the oscillator run at without the touch?
  • What % change in frequency can we detect reliably? How will we do that detection?

but I’m not happy with my choice of an LM555 chip for the oscillator.  It is a fine choice for many purposes, and a good chip for students and hobbyists to learn about, but the Fairchild Semiconductor LM 555 data sheet does not do a good job of explaining how the chip works nor exactly what the logic function is for triggering the flip-flop.  As a result, students will probably end up just copying the astable circuit without really understanding it.

I think I would prefer to have them use an op-amp multi-vibrator circuit.  It can’t quite be modeled with only linear op amps, as it relies on clipping of the output to get nearly a square wave.

Op amp multivibrator. The first op amp is just to set up a virtual ground halfway between the power rails. The second op amp does the oscillating (at about 8.12 kHz for these components). Circuit drawn with CircuitLab, which is not capable of simulating it.

The op-amp multivibrator is a simple design.  When the output is high, C1 is charged until V_minus is higher than the positive input of the op amp (about 34.7% of the way from Vbias to Vout=Vdd).  Then the output goes low (taking about 6µsec, limited by the slew rate of the op amp), and the capacitor discharges until it is below the positive input (about 65.3% of the way from Vbias to Vout=0 with these values for R4 and R5). So Vminus swings from (1-0.6526) Vbias = 0.1737 Vdd to Vbias+0.6526(Vdd-Vbias)=0.8263Vdd.  The time it takes to charge or discharge should be about ,  where the time constant τ=R3 C1.  For the values of R4 and R5 here, the charge time should be 1.560 τ, and the period 3.119 τ. With the given values of R3 and C1, this should be a period of 102.9 µsec, or a frequency of 9.7 kHz.   I’m measuring 8.1 kHz, not 9.7 kHz, but I think that the discrepancy is due to the slew rate limitations (which add about 12 µsec to the period) and possibly stray capacitance.  With C1=47 nF, the frequency is 203.6 Hz, when the calculation says it should be 206.7 Hz, well within the accuracy of the components.

Connecting the foil-and-plastic-wrap sensor to Vminus adds a little stray capacitance, dropping the frequency to 8.01 kHz. Touching the sensor drops the frequency to 7.5 kHz–7.7 kHz, adding about 5 µsec–8.5 µsec to the period, consistent with adding about 50pF – 83 pF to C1.  This is a little smaller than the 163 pF that I estimated using the parallel-plate model in Capacitive sensing, but consistent with my measurements using the LM555 circuits.

I can get a much stronger effect if I remove C1 from the circuit, and use only stray capacitance.  The period drops to about 6.2 µsec (roughly 160 kHz), but (because of the slew rate limitations of the op amp) is not full scale and is essentially a triangle wave.  Touching the sensor reduces the frequency to about 35 kHz – 45 kHZ, an increase of 16 µsec – 22 µsec in period, consistent with an additional capacitance of  155 pF – 220 pF, which is about what was predicted by the parallel plate model. I’m a little reluctant to put this signal into an Arduino board, though, as the no-touch signal spends most of its time in the non-digital region between high and low, and only barely crosses the thresholds that would allow the ATMega328 chip to detect the signal.

One interesting idea would be to take advantage of the change in amplitude of the oscillation to make an all-analog touch detector.  I’m afraid that would not be very robust, though, as an increase in the period of only 12 µsec is enough to make the oscillation full scale.


Filed under: Circuits course Tagged: Arduino, bioengineering, capacitive touch sensor, circuits, course design, LM555, op amp, sensors, teaching

Capacitive sensing, part 2

The obvious next step with the capacitive sensor is to make the sensor actually control something.  This is not essential for the circuits class—for that class it is better to have the students viewing the waveform on the oscilloscope and seeing the frequency of the output vary  as the touch varies.  But I was curious about whether the various grounds (oscilloscope, USB cable, wall wart power supply) were making a difference to the capacitive sensing, so I wanted to redo the capacitive sensor to be a fully battery-based application, with no external ground connections.

To display whether the sensor had been touched or not, I turned on or off the LED on pin 13. I used the same software detection mechanism as in the previous post, counting the number of pulses it takes to get a total time for the signal being low. Touching my laptop (to reduce the resistance to ground) no longer makes a difference in the sensitivity of the switch, now that the battery ground is separated from the laptop ground.

// Capacitive sensor switch
// Mon Jul  9 06:05:54 PDT 2012 Kevin Karplus

// To use, connect the output of the LM555 oscillator to
// pin CAP_PIN on the Arduino.
// The code turns on the LED on pin 13 when a touch is sensed.

// The Arduino measures the number and width of LOW pulses on pin 2 until
//    the sum of the pulse width exceeds TOTAL_PULSE_USEC.
// The LED is turned on if the number of pulses is less than NO_TOUCH_NUM

#define CAP_PIN (2)

#define TOTAL_PULSE_USEC (100)	// total of pulse widths (in  microseconds) before reporting
#define NO_TOUCH_NUM (50)

void setup(void)
{
    pinMode(CAP_PIN,INPUT);
    pinMode(13, OUTPUT);
}

void loop(void)
{
    uint32_t pulse_sum=0;
    uint16_t num_pulses=0;
    while (pulse_sum<TOTAL_PULSE_USEC)
    {   pulse_sum += pulseIn(CAP_PIN,LOW);
        num_pulses++;
    }
    digitalWrite(13, (num_pulses<NO_TOUCH_NUM? HIGH:LOW));
}

I had to set the threshold a bit higher than I expected, indicating that the frequency shift was not as large without all the connections to ground, but the sensor still works with a moderately firm touch. With a light touch, the LED flickers on and off, indicating that the frequency shift is near the threshold. Raising NO_TOUCH_NUM too high has the LED always on. Even raising it from 50 to 55 makes the switch too sensitive—the LED turns on when my finger is still 5mm away from contact. Perhaps the ideal setting is 52, as that detects a light touch fairly reliably, but doesn’t fire until my finger is within about 1mm of the surface.

Note: it might make more sense to leave NO_TOUCH_NUM at 50 and adjust TOTAL_PULSE_USEC down to 96, since the larger number can be adjusted more finely.

If I wanted to avoid the flicker, I would debounce the detection.  I can’t use the Arduino Bounce library for this, as the signal that needs debouncing is in software, not on a pin.  It is a trivial matter to add a delay whenever the output changes, though:

// Capacitive sensor switch
// Mon Jul  9 06:44:33 PDT 2012 Kevin Karplus

// To use, connect the output of the LM555 oscillator to
// pin CAP_PIN on the Arduino.
// The code turns on the LED on pin 13 when a touch is sensed.

// The Arduino measures the number and width of LOW pulses on pin 2 until
//    the sum of the pulse width exceeds TOTAL_PULSE_USEC.
// The LED is turned on if the number of pulses is less than NO_TOUCH_NUM.

// pin that LM555 output connected to
#define CAP_PIN (2)

// total of pulse widths (in  microseconds) before reporting
#define TOTAL_PULSE_USEC (96)

// minimum number of pulses to indicate that sensor is not touched
#define NO_TOUCH_NUM (50)

// time (in milliseconds) to wait after a change in state before
// testing input again
#define DEBOUNCE_MSEC (100)

static uint8_t was_on;

void setup(void)
{
    was_on=0;
    pinMode(CAP_PIN,INPUT);
    pinMode(13, OUTPUT);
}

void loop(void)
{
    uint32_t pulse_sum=0;
    uint16_t num_pulses=0;
    while (pulse_sum<TOTAL_PULSE_USEC)
    {   pulse_sum += pulseIn(CAP_PIN,LOW);
        num_pulses++;
    }
    uint8_t on = num_pulses<NO_TOUCH_NUM? 1:0;
    digitalWrite(13, on);
    if (on!=was_on)
    {   delay(DEBOUNCE_MSEC);
        was_on=on;
    }
}

Debouncing does not completely eliminate multiple flashes. If I hold my finger very steady just touching the sensor or my whole hand flat about 1mm away, the LED will flash on and off about 5 times a second (the speed of the flashing is determined mainly by DEBOUNCE_MSEC).

Really good code would not require fixed NO_TOUCH_NUM and TOTAL_PULSE_USEC, but would learn what values are usual for off and on states and set the thresholds to separate them reliably.  I’ve not figured out a good way to do this as unsupervised learning. It would not be very difficult to have initial settings, gather averages for on and off states, then dynamically adjust the threshold, but I don’t know how stable such threshold setting would be. I suspect that it would end up rather unreliable, and highly dependent on good initial settings.


Filed under: Circuits course Tagged: Arduino, bioengineering, capacitive touch sensor, circuits, course design, LM555, sensors, teaching

Capacitive sensing

I decided that it was time to try a new circuits lab today.  Although I have the INA-126 instrumentation amplifier working (with a 220Ω gain resistor for a gain of about 370), and I did get some EKG stick-on electrodes, I don’t feel like trying to debug the EKG lab today.  I could do a little more with the instrumentation amplifier and the new function generator, adding the function generator output to the microphone output to see try to separate the differential gain from the common-mode gain, but I’m getting a bit tired of op-amp and instrumentation amp circuits.  I’ll try to come back to them later.

Other sensor ideas from What sensors for circuits class? that I have the parts for now include phototransistors, LEDs and IR emitters, and reflectance light sensors, but I don’t feel like playing with phototransistors today either.  That leaves one rather do-it-yourself sensor: a capacitance touch switch.  I was thinking of implementing this with LM555 timer chip as an oscillator, detecting capacitance increase as a change in the frequency of the oscillator.

Design questions include

  • What capacitance do we add by touching something?
  • What frequency should the oscillator run at without the touch?
  • What % change in frequency can we detect reliably? How will we do that detection?

Capacitance

Let’s do a first-principles calculation of capacitance of a touch, using a simple parallel-plate model.  Let’s say that the area of the touch, pressing lightly with a finger, is about 1cm^2.  We need to know the dielectric constant of the insulator and its thickness.  Let’s say we use a cheap plastic  wrap from the grocery store.  According to Wikipedia, common plastic wraps are about 0.5 mils (12.5 µm) thick and are now generally a low-density polyethylene (LDPE).  According to Bert Hickman (referring to sites that no longer exist), the relative dielectric constant for LDPE is 2.2, with a breakdown voltage of 3000v/mil (or 1500v for 0.5mil).  Of course, he also claims that the common wrap material is a mix of PVC and PVDC, which seems to be out of date information. The A to Z of Materials site for LDPE claims

Dielectric Strength (MV/m) 27
Dissipation Factor 1kHz 0.0003
Dielectric Constant  1kHz 2.3

That dielectric strength would be 337V at 12.5µm, which seems more reasonable than Bert Hickman’s numbers.

I also have 3M contractor’s plastic for masking large areas when painting. It claims to be 8.9 µm thick, but I can’t figure out what the material is (they just say “high density plastic”).  If it is HDPE (a possibility), the A to Z of Materials site for HDPE claims

Dielectric Strength (MV/m) 22
Dissipation Factor 1kHz 0.0005
Dielectric Constant  1kHz 2.3

which gives the same dielectric constant as LDPE, but the breakdown voltage would be about 195V at 8.9µm—still plenty for a touch sensor.

If I have 1 cm^2 (1E-4 m^2) area, 5 mil thickness (12.5E-6m), relative dielectric constant of 2.3, and ε0=8.8542E-12 F/m, I get a capacitance of 163pF for the touch.

Frequency

The LM555 can be set up as an astable oscillator:

LM555 astable oscillator circuit from the Fairchild Semiconductor LM 555 data sheet.

The data sheet gives the period of the oscillator as and the frequency as . If I want a slow oscillator, I’ll need to use a large resistance.  The largest resistance they show in the data sheet is RA+2RB=10MΩ, and I happen to have some 3.3MΩ resistors, so 9.9MΩ seems reasonable.  If I had no stray capacitance, 163pF and 9.9MΩ would give a period of 1.6msec (620Hz).  But, of course there will be substantial stray capacitance—probably much larger than the touch capacitance.  In any event, the increment to the period of the oscillator by adding the touch capacitance should be about 1.6msec, so we need to be able to detect that small a change in the period.  The percentage change will depend mainly on the stray capacitance.

One thing that is not clear from the LM555 data sheet is what value should be used for C2.  I suspect that it is just a bypass capacitor to reduce noise in the reference voltages used for the threshold, so a 4.7µF ceramic capacitor (of which I have several) should do fine.  Design notes I’ve seen on the web suggest that 0.1µF is plenty, though a bypass on the Vcc input of that amount is also recommended.

Experiment

I set up the circuit on the breadboard, with RA=RB=3.3MΩ, C1 being just the stray capacitance in the circuit, and C2 being a 4.7µF ceramic bypass capacitor. I also put a 4.7µF bypass capacitor between pins 1 and 8, as well as a 470µF electrolytic capacitor, to make sure that the power supply was clean.

The resulting oscillator has a period of about 0.2msec (4.4kHz), but it fluctuated a lot, so that I could not get a clean trace on my oscilloscope. Touching the insulted sensor pad (made from Al foil and Glad Cling Wrap) caused the period to increase enormously, but to a pulse train of 3 pulses that repeated at 60Hz.  I believe that what I was mainly doing was coupling in a 60Hz noise signal, rather than detecting a change in the capacitance to ground.

I could decrease the sensitivity of the circuit to noise by reducing the resistances and adding some more capacitance to C1. Adding 1nF cleans up the signal, but doesn’t eliminate the problem.  I get 107±1Hz without a touch, and 60Hz with a touch.  I’m still mainly coupling in 60Hz noise!  I’d have to reduce the impedance to reduce the 60Hz coupling, reducing RA and RB.

Leaving in the 1nF capacitor and reducing RA and RB to 100kΩ results in a non-touch frequency of 4.05kHz and a touch frequency of 3.6kHz.  This is about a 30µsec difference in period, consistent with an 150pF change in capacitance. But this frequency change seems to be almost independent of the area of contact, which is not consistent with a parallel plate model.  The lower frequency still seems to be modulated by a 60Hz hum.

Removing the 1nF capacitor, but leaving the 100kΩ resistors, I get a no-touch frequency of 140kHz–156kHz (depending on how close my arm comes to the sensor) and a touch frequency around 45kHz–50kHz, a 15µsec difference in the period. A firm press with all my fingers depresses the frequency further, down to about 20kHz. Touching my laptop (reducing my resistance to ground) decreases the frequency further—pressing with my palm and touching the laptop gets the frequency own to about 13kHz.

Here is the complete layout for the capacitive touch sensor, showing (clockwise) the aluminum foil wrapped in Glad Cling Wrap (except for the folded over part where the alligator clip is attached, the breadboard with the LM555 chip, and the Arduino board.

I wouldn’t want to use the interrupt-driven timer code to measure this frequency, but a simple busy-wait loop that times the period could work, or I could add a counter to divide the frequency down (and average out many clock cycles).  But this is supposed to be a circuits class, not a digital design class, so adding a counter is probably not appropriate for the lab.  Perhaps a better approach is to measure the duration of the low part of the pulse, which should be about 1/3 of the total period, using the Arduino pulseIn function.  Looking on the scope, the low part of the pulse seems to be closer on 1/6th of the total period than to 1/3 at the high frequency, though the ratios are more reasonable at the low frequency.  I suspect that there are stray capacitance within the LM555 that account for some of the pulse shape error.

By averaging over 500 pulses, I see a switch from 1.15±0.03 µsec for the low pulse in the no-touch configuration to 5.4±0.3µsec for a firm touch and 2.8±0.2µsec for a light touch (and up to 220µsec for a full-palm touch while touching my laptop). Single pulse measurements may be a bit unreliable at those speeds, since pulseIn only has 1µsec resolution, but adding 500 pulses doesn’t take much time, unless the capacitance is very high. Putting the 1nF capacitor back in the circuit makes the low time look more like 1/3 of the period.  The pulse widths are about 78.4±0.05µsec for no-touch and 80µsec–85µsec for a touch.  Those are long enough to be reliably detected with even a single pulseIn call, but the difference is rather small, so setting a fixed threshold would be a bit risky.

An alternative approach to averaging 100s of pulse widths is to collect pulses until the total pulse width exceeds 200µsec and report the number of pulses collected.  That mechanism results in an easily detected change in counts (from over 150 to under 60) and a response time of about 2–5msec (most of which is probably in the serial communication).  A detection threshold would have to be set for each different sensor plate the circuit is connected to, but that is pretty straightforward.

Here is the code I used for detecting sensor touches with summed pulse widths (click to expand):

// Capacitive sensor timer
// Sun Jul  8 17:59:49 PDT 2012 Kevin Karplus
//
// License: CC-BY-NC http://creativecommons.org/licenses/by-nc/3.0/
//
// To use, connect the output of the LM555 oscillator to
// digital pin 2 on the Arduino.
// On initialization, the Arduino will print "Arduino ready." to serial.
// The Arduino measures the number and width of LOW pulses on pin 2 until
//    the sum of the pulse width exceeds TOTAL_PULSE_TIME.
// It then reports 3 numbers to the serial line:
// The first is the time since the start, in microseconds.
// The second is the number of pulses measured.
// The third is the average duration of the pulses.
// Serial baudrate is 115200.
// The start time may be reset by sending the character 'R'.

#define TOTAL_PULSE_TIME (200)	// total of pulse widths (in  microseconds) before reporting

unsigned long first_time;   // what was the time for the first tick since reset?
// All times are in microseconds.

// do_reset() empties the queue and sents the count to 0
void do_reset(void)
{
    noInterrupts();     // don't take interrupts in the middle of resetting
    first_time=micros();
    // let the user know that the Arduino is ready
    Serial.print(F("\nArduino ready.\n"));
    interrupts();
}

// interrupt handler for data becoming available on the serial input
// Reset if an R is received
void serialEvent(void)
{
    if (Serial.read() == 'R')
    {
        do_reset();
    }
}

void setup(void)
{
    Serial.begin(115200);       // use the fastest serial connection available
    do_reset();
    pinMode(2,INPUT);
}

void loop(void)
{   // keep trying to print out what is in the queue.
    uint32_t pulse_sum=0;
    uint16_t num_pulses=0;
    while (pulse_sum<TOTAL_PULSE_TIME)
    {    pulse_sum += pulseIn(2,LOW);
        num_pulses++;
    }
    uint32_t datum=micros();
    Serial.print(datum - first_time); // time since start (usec)
    Serial.print("\t");
    Serial.print(num_pulses); // number of pulses
    Serial.print("\t");
    Serial.println(pulse_sum*(1.0/num_pulses), 2); // avg pulse duration
}


Filed under: Circuits course Tagged: Arduino, bioengineering, capacitive touch sensor, circuits, course design, LM555, sensors, teaching