Posts with «vu meter» label

VU Meter Built With Neat Graphical VFD Display

VFD displays are beloved for their eerie glow that sits somewhere just off what you’d call blue. [mircemk] used one of these displays to create an old-school VU meter that looks straight out of a 1970s laboratory. 

The build uses an Arduino Nano as the brains of the operation, which uses its analog inputs to process incoming audio into decibel levels for display on a VU meter. It’s then charged with driving a GP1287 VFD display. Unlike some VFDs that have preset segments that can be illuminated or switched off, this is a fully graphical dot matrix display that can be driven as desired. Thus, when it’s not acting as a bar graph VU meter, it can also emulate old-school moving-needle meters. Though, it bears noting, the slow updates the Arduino makes to the display means it’s kind of like those dodgy skeumorphic music apps of the 16-bit era; i.e. it’s quite visually jerky.

Overall, it’s a neat project that demonstrates how to work with audio, microcontrollers, and displays all in one. We’ve featured other projects from [mircemk] before, too, almost all of which appear in the same blue and grey project boxes. Video after the break.

Hack a Day 22 Dec 00:00

VFD Character Display Turned Into Audio VU Meter

Humans love visualising music, whether it’s in the form of an inscrutable equation drawing squiggles in Winamp, or a simple VU meter pulsing with the beat. This build from [mircemk] is of the latter variety, repurposing a VFD display to do the job.

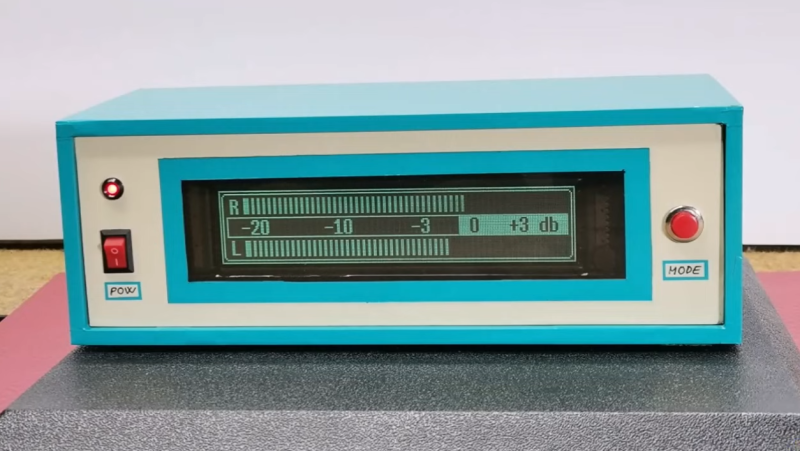
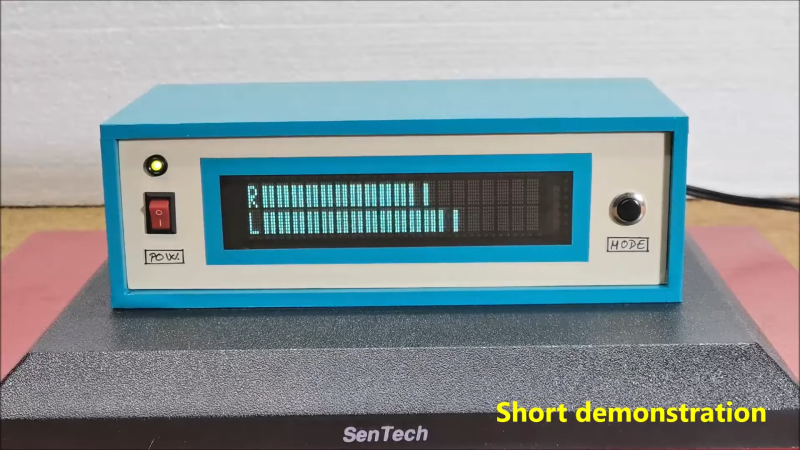
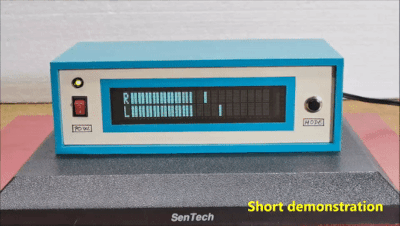
The project is built around a VFM202MDA vacuum fluorescent display, which provides that lovely green-blue glow we all know and love, driven by a PT6314 driver chip. This has the benefit that it can be readily driven by a microcontroller in much the same way as the familiar HD44780 character LCD driver chip. With some minor tweaks, the character set can be modified to allow the display to become a surprisingly-responsive VU meter.

An Arduino Nano runs the show, with an envelope follower circuit feeding a signal for the left and right channels into the analog inputs of the microcontroller. The Arduino then measures the voltage on those inputs and feeds the necessary commands to the PT6314 driver to update the display.

The resulting VU meter has 38 bars per channel, and is highly responsive. The fast flickering of the meter bars in response to the music make it compelling to watch, and the era-appropriate enclosure the project is built in adds plenty to the aesthetic.

We’ve seen other VU meter builds before too, like this one that uses a little physics knowledge to create a more realistic analog-like needle meter. Video after the break.


Don’t Guess, Listen to Your Plants’ Pleas for Water

Plants are great to have around, but they all have different watering needs. If only they could cry out when they’re thirsty, right? Well, now they can. All you need to hear them suffer is your very own Klausner Machine. [RoniBandini] based the Klausner machine on one of Roald Dahl’s short stories, which features an inventor who builds a machine that can make audible the sound of plants shrieking whenever they’re cut.

In [RoniBandini]’s version of the Klausner Machine, the point is to judge the plant’s feelings based on its soil moisture content. An Arduino Nano reads in from the soil moisture sensor, and if the soil is dry, the plant screams. If the soil is moist, the plant emits happy sounds from DF Player Mini and SD card.  We think the analog meters are a great touch, and the jumping needles really anthropomorphize the plant.

Go forth and gain a better appreciation for your plants’ feelings, because this project is wide open. Maybe it will help you water them more often. Some plants need to be cut back, so we think it would be cool if you could make it scream when you take a cutting. Check out the demo after the break.

This is isn’t the first time we’ve seen an analog meter used in conjunction with soil moisture. What is a VU meter, anyway? Our own [Dan Maloney] really moved the needle on the subject a while back.

An Arduino VU meter for classrooms

With his beautifully-colored classroom “noise-o-meter,” Mr. Jones knows when things are getting out of hand.

When you were in school (or if you are in school) the teacher likely told the class to be quiet, perhaps repeating him or herself over an over during the day. The teacher, however, likely never really defined what is good and bad. Mr. Jones has finally solved this issue by creating a classroom “noise-o-meter” using an Arduino, an electret microphone, and a programmable LED strip. In order (apparently) too keep the class in line, noise is simply marked as green for “expected,” amber for “louder,” and “red” for too loud which corresponds nicely with more “traditional” VU meters.

I built this a short while ago as an idea to use in a primary classroom setting. Poster displays are often used by primary teachers wanting to control the noise levels in their classrooms but I wanted to add technology to make it dynamic and responsive. The motivation for this came after seeing the Adafruit Digital NeoPixel LED Strip online and realizing its potential as part of a VU meter.

Are you a teacher and want to build one for yourself? You can check out Mr. Jones’ Instructables page or his own website in a different format.

Build a simple VU meter with an Arduino Uno and LEDs

If you’ve been looking for a simple audio Arduino project, you may want to check out this VU meter from YouTuber RZtronix. The Maker built the device using an Uno along with some LEDs, a couple wires, a breadboard, a sound sensor, and a 5V power supply.

3D Printed Bracelet Illuminates On The Beat

Maker Michael Barretta created an LED bracelet that is responsive to sound by combining the technology of light organs and Adafruit’s GEMMA microcontroller. The result is groovy.

Read more on MAKE

MAKE » Arduino 15 Aug 23:01

TRUE ANALOG AUDIO VOLUME CONTROL (T.A.A.V.C.).


More:   Video1   and   Video2

Now my Arduino can precisely measure audio input (VU meter),   and obviously, next thing that comes to mind right after measurements, is regulation or control. There are many different ways how to electronically adjust audio volume or level of AC signal.  I’ll name a few:

  • Specifically design IC, Digital potentiometers.
  • Mechanical potentiometers, driven by servo / motors.
  • Vacuum tubes amplifiers in “variable-mu” configuration.
  • Resistive opto-isolators.

First category (#1) fits nicely for arduino project. But it’s not interesting to me. My apologies to someone, who was searching an example of interface between arduino and digital pot. Other people don’t tolerate semiconductors in audio path ( tube sound lovers ). Third option would make them happy, only (#3) requires high voltage and difficult to accomplish on low hobbyist budget, so I left it out of the scope. Mechanical pot (#2) would be good solution to satisfy Hi-Fi perfectionists and arduino fans. The same time response time of mechanical parts is too slow, verdict – discarded.  (#4) have been in use since 1960s, but would you like your lovely music to be adjusted by highly toxic CdSe / CdS ?  I don’t think so. Wiki says opto-isolators have low THD distortion level, less than 0.1%. Probably true, but apart from technical aspect, there is always psychological, poisonous CdSe affects my perception.

How about variable resistor in it’s simplest form – tungsten wire? Where you can get one? In the electrical bulb. Perfect material for audiophiles – where distortion could get into ? – It’s pure metal ! And here is my design of the “basic cell” – True Analog Audio Volume Control (T.A.A.V.C.)

As you can see, cell consists of 5 bulbs plus 1 resistor. All elements form 2 attenuation stages, basically – voltage dividers with variable resistors. Resistive values of bulbs proportional to temperature, which is easy to control passing DC current through. To make it work with the biggest possible dynamic range, middle bulb is also heated up by current flow from two differential control lines / phases.

 Hardware prototype / Proof of Concept.

Differential Power Amplifier (PA) IC LM4863  is used as DC current source for control lines. Circuitry powered from 5V regulated switching power supply (4A).  Bulbs – clear mini lights, 2.5V, approximately 200 mA. Cold state resistance about 1.2 – 1.5 Ohm, hot state resistance is rising up to 15 Ohm.  Volume regulator could be connected to any audio source with output impedance no more than 32 Ohm, for example, headphones output. For test I used second channel of the PA, that shown in “optional” box on the left side. Second channel is a “nice to have” feature  in stereo version of the project, when both channels would drive two separate TAAVC cells, so using it as a “buffer” amplifier may be not an option.

Results.

  Measured attenuation  range of the “basic cell” is  20 dB, or 10 x times.

 to be continue…

 Chart, PWM (Voltage) to Attenuation:

 Quite interesting, isn’t it? I was not expecting it’s to be linear, but changing direction surprised me. There is one things, which could explain such abnormality, is that when voltage on the control lines 1 and 2 ( LM4863 outputs ) is approaching power rails, output impedance of the power amplifier is increasing, and consequently, attenuation characteristics of the basic cell deteriorate. It means, that in order to keep attenuation curve gradually declining, more powerful PA necessary. For now, I limited PWM to 0 – 200 range.

I’m thinking, STA540  powered from +12V, and 5 V bulbs would make sense to try next time.  Probably, replacing middle bulb for less current hungry, will increase max attenuation per cell up to 30-35 dB.

 O’K, after I get this data, how could I “straighten it up” for practical use ?  Volume control device, could be linear or logarithmic, but chart doesn’t resemble nether of this. And this is exactly what I need Arduino for.

Linearization.

 If you, by chance, have read this page, than you know how to do this part. Polynomial approximation. Unfortunately,  2-nd degree polynomial I used last time is not enough for VERY non-linear curve like I have. So, I “upgraded” my calibration subroutine (method: LEAST SQUARES) up to 3-rd degree:

void calibrate()
{
 //Least squares 3-rd degree polynomial coefficient calculation
 float arr[10][5] ={{0},{0}}, err[10] = {0}, coeff[10] = {0};

 err[0] = 10;
 for(uint8_t i = 1; i < 7; i++)
 {
  err[i] = 0;
  for(uint8_t j = 0; j < 10; j++)
  {
   err[i] += pow(level_table[j], i);
  }
 }

 for(uint8_t i = 0; i < 4; i++)
 {
  for(uint8_t j = 0; j < 4; j++)
  {
   arr[i][j] = err[i+j];
  }
 }

 for(uint8_t i = 0; i < 4; i++)
 {
  arr[i][4] = 0;
  for(uint8_t j = 0; j < 10; j++)
  {
   if (i==0) arr[i][4] += calibration[j];
   else arr[i][4] += calibration[j] * pow(level_table[j], i);
  }
 }

 for(uint8_t k = 0; k < 4; k++)
 {
  for(uint8_t i = 0; i < 4; i++)
  {
   if ( i != k )
   {
    for(uint8_t j = (k + 1); j < 5; j++)
    {
     arr[i][j] -= ((arr[i][k] * arr[k][j]) / arr[k][k]);
    }
   }
  }
 }

 union split_float {
 uint16_t tegri[2];
 float loatf;
 } sf; 

 for(uint8_t i = 0; i < 4; i++)
 {
  coeff[i] = ( arr[i][4] / arr[i][i]);
  sf.loatf = coeff[i];
  store_entry(( 2 * i ), sf.tegri[0] );
  store_entry(( 1 + (2 * i)), sf.tegri[1] );
 }
}

Procedure takes 10 data samples as input, calculates 4 coefficients and stores them in EEPROM memory.

VU meter based on Arduino UNO ( in minimum configuration Arduino and DC offsetting circuit ) should be connected right to T.A.A.V.C. output. Everything works in automatic mode, with results printed on serial monitor for review. Stable AC input is necessary, which easy to get from any PC sound card based signal generator, recorded media file or lab sine-wave generator. Arduino also provides PWM for T.A.A.V.C       via pin D3 (TIMER2 OCR2B).

Link to download Arduino UNO sketch: T.A.A.V.C.

to be continue…audio compressor, .

Last part,

Dynamic Range Compressor.

There are two important parameters defined in the beginning of the sketch:

#define          CMP_THRE                     -10             // Compression Threshold 
#define          CMP_RATE                        4             // Compression Ratio 4 : 1

Threshold and Ratio. I’m not into explaining all bunch of the details about compressors or what for do you need one, rather forward you to this link.  I only want to say, that I didn’t find any evidence that someone ever used electrical bulbs as compressors “engine”. So, this is my idea, and my implementation.

Technical specification of this design is quite modest, having close to 20 dB maximum attenuation and setting ratio to 2:1, threshold couldn’t be set lower than -40 dB. Good news, that for practical use in home environment it’s  really unlikely, that you ‘d need more. It’s also should be enough to solve a problem with annoying TV or Radio commercial / advertisement.

Compare to VU Meter project, I’ve made a few “relaxing” changes to the code, as it appears there are no strict industry standard on Dynamic Range Regulation. I reduce sampling rate down to 10 kHz,  and  split Low Pass Filtering in two sections. One is the same, as in VU Meter, inside sampling interruption subroutine, only with lower time constants. First LPF section is responsible for “shaping” attack and decay timing. Using quite inertial electrical bulbs in the project, reduce importance of this timing. Here attack and release mostly defined  by thermal responsiveness of the bulbs, which isn’t very high. Decreasing software LPF time constants helps to improve sensitivity. Other LPF section included inside LCD drawing function, works to overcome display slowness, suppressing LCD flickering. Other changes from simple VU Meter, is that finally I “scaled” everything correctly,  and “0″ db corresponds exactly to 1.228 V RMS at the input. Threshold level -10 expressed in dB as well. You may see threshold “mark” above the log scale. Indicator “needle” just below it, small 5×2 pixels only, but you can make it bigger if you wish.

I already described calibration procedure, to do it right, you need to connect arduino to output of the TAAVC cell.  Polynomial coefficients and minimum / maximum constants stored in EEPROM, so you don’t have to do this procedure each time after power cycling.  In normal mode arduino getting input measurements from the cell input:

Finished.  I’ll do a video “on demand” -);  If I had time…

Arduino UNO sketch:  Audio Dynamic Range Compressor. (TAAVC part 3).


Audio VU Meter.

Simple project, some kind of “Arduino-Wiki” for beginners.

How to do measurements right:

  1. Biasing AC input using resistor divider and scaling up / down if necessary;
  2. Sampling fast and accurately using direct access to Control Registers of ADC and Timer1;
  3. Subtract whatever was added at step #1 from result of Analog / Digital conversion and Square;
  4. Average / accumulate, filtering following VU specification;
  5. Sqrt – take square root, Log10 – transform to dB scale;
  6. Display.

 1.   Hope, you follow my advice and hack your cheap USB speakers, to get nice ( pre-assembled ! ) analog “front-end” for this project. If not, than get your soldering iron to work, minimum two resistors and 1 cap would required, assuming you already have display wired up and running.

 First things with AC measurements ( audio in this category ) on Atmel microcontroler is to get rid of negative half-wave of the input signal, and this what front-end circuitry should do. There are at least two option: rectifying AC to DC before voltage could reach arduino analog input, or biasing signal with external DC offset. Rectification, could nicely be done with help of specifically design IC, LM3914 / 15 / 16 for example. But in this article, I’d describe second alternative, as it’d be not fare to ask you to hack your speakers and than tell you to solder another board…. Here is my set-up, slightly modified version from last blog:

When AC input signal is mixed with DC offset, so it stays always in positive area, ( think about sine, which defined betseen -1 and +1, if I add +1 it always would be positive ), I only save arduino life, preventing it from destruction by negative voltage. When arduino ADC completes conversion from analog to digital form, I don’t need DC offset anymore, and it should be subtracted.

  NOTE: DC voltage was added just to pass audio through arduino ADC. 

2. Sampling subroutine is running at 40 kHz, that is more than enough for ANY application. You may decrease sampling rate to lower CPU load, with current settings VU metering consumes more than 50%. Higher sampling rate gives better linearity / precision over wide band, the same time with regular audio content even 10 kHz sampling would provide better than 1 dB accuracy. All input capture process goes in Interruption subroutine, which is configured in setup. Two channels of Timer 1 Configured to run in parallel, “A” is responsible to keep clock at 40 kHz sharp, and “B” fires start conversion event to ADC with the same speed. Restarting new conversion via hardware provides lowest phase noise compare to any other way of doing this.

     ADCSRB = ((1<<ADTS2)| // Sets Auto Trigger source – Timer/Counter1 Compare Match B
                       (0<<ADTS1)|
                       (1<<ADTS0));

/* Set up TIMER 1 – ADC sampler */
       TCCR1A = ((1<<WGM11) | (1<<WGM10)); // Mode 15, Fast PWM
       TCCR1B = ((1<<WGM13) | (1<<WGM12)); // Mode 15, Fast PWM

       TCCR1B |= (1<<CS10); // clk/1 prescaling.
       OCR1A = SMP_TMR1;
       OCR1B = SMP_TMR1;

      TIFR1 |= (1<<OCF1B); 
      TIMSK1 |= (1<<OCIE1B);

3 .  As you can see in a code snipped below, adc_Offst is subtracted from new ADC result. Quite simple, value of DC offset ( adc_Offst ) was obtained in setup() during start up, using Arduino IDE “analogRead”. The only problem with this simple solution, is that no audio should be present at this moment ( start up ) at input, otherwise all measurements would be erroneous.

 ISR(TIMER1_COMPB_vect)
   {  
      int32_t temp = ADC – adc_Offst; 
                 temp = temp * temp;
      if ( temp > ppm_Level ) ppm_Level = ((ppm_Level * 255) + temp) >> 8;
      else ppm_Level = (ppm_Level * 16383) >> 14; 
   }  

4. The same piece of code includes VU filtering algorithm. I was trying to get as close to standard as possible, but tough timing requirements ( 25 usec ! ) doesn’t allow get full satisfaction. Attack time is very close to specification, 3 milliseconds or so. Decay, I’d estimate in 200 milliseconds, which is less than recommended 650 milliseconds for Peak Program Meter (PPM), and also less than 300 milliseconds for regular VU.  The limits come from 32-bit integer math, from one side, and high sampling rate from another.

updated:

This comparison operator     if ( temp > ppm_Level )  separates attack – when new value is bigger than stored, and decay – when new value is smaller. Now, lets me explain what this line of code does:

     ppm_Level = ((ppm_Level * 255) + temp) >> 8;
Rewriting it to:  ppm_Level = ((ppm_Level * 255) + temp) / 256;

and than:          ppm_Level = ppm_Level *  ( 255 / 256 ) + temp * ( 1 / 256 );

reveals:            ppm_Level = ppm_Level *  0.99609375 + temp * 0.00390625;

Which is simple, single pole Low Pass Filter. For more details on recursive filtering I’d refer to this book. Equation 19.2.   Trick with right shift operator (>>8) is just to improve speed of calculation. Remind you, that Arduino doesn’t have floating point CPU, and any mathematics work with floating point coefficient very slow.

Same with filtering decay process, the difference is only in coefficient value.

( >> 14) is the same as 1 / 16384,   and so   16383 / 16384 = 0.999938965.

5.   Read comments, please:

    int32_t temp;

     temp = ppm_Level;                        // Take a copy, so Real Value not affected by calculation.
     temp = sqrt(temp);

    rms_Level = 20.0 * log10(temp +1); // Calculated, available over Serial

6. Last part, drawing VU indicator on graphical display. Ones again, referring you to short hardware description of using model.  There is not much to say, all display interface based on GLCD library. The only “tweak” from my side, is that I added “if” condition in front of drawing needle subfunctions:

      if ( abs(st1 – st2) > 3 )                          //  ~1/3 dB

I discovered, that DrawLine is quite slow, 4 calls ( 2 – erase, 2 – draw, all double – to make needle thicker ) take 125 milliseconds, so it make sense not to draw anything if there is not big difference between old and new needle position. At least, new position has to be off by width of the needle itself.

Link to Arduino (UNO) sketch: download.


Audio VU meter (AC microVoltmeter) with Extra wide Dynamic Range 69 dB.

O’K, after having some fun with stereo version of the VU meter I described in my previous blog-post, now it’s time to do a serious stuff. Studio grade VU meter !!! 24 steps, equally spaced every 3 dB, covering Extra wide Dynamic Range from -63  up to  +6 dB.  Single (mono) channel this time, no messing around, absolute precision at the stake. Plus, it keeps absolutely Top-Flat linear frequency response from 40 Hz up to 20 kHz(*).


I’m not going into details of RGB LEDs Display, which has no modification since “Tears of Rainbow” project, only plates installed in one line, form a single GIGANTIC bar-graph. There are some minor changes in mixing colors data tables, but they intuitively understandable.  The most important feature in this project is autoscaling. As you, probably know, Arduino has 10 bits ADC. Only it can’t process negative half-wave, and for this reason it has only 9 bits available for AC measurements.  According to DSP theory, maximum dynamic range is:

DR = 1.77 + 6.02 x B = 1.77 + 6.02 x 9 = 55.95 dB.

 As input audio waveform represents anything but perfect peak-to-peak 5V sine-wave, real dynamic range would be lower. How much? In first, there is a hardware limits.  OPA (NE5532), which is:

  • very low noise !!!
  •  high output-drive capability;
  •  high unity-gain and maximum-output-swing bandwidths;
  •  low distortion;
  •  high slew rate;
  •  input-protection diodes, and output short-circuit protection

 but, unfortunately,  isn’t rail-to-rail type. Test results show, that compression  become noticeable (~1 dB) when not scaled magnitude approaches level about 50 dB. That is in good agreement with observed on oscilloscope not distorted deviation peak-to-peak 2.5 V. Or only half of full range of 5V. And as theory says, half is one bit less, and real DR = 1.77 + 6.02 x 8 = 49.93  (~50 dB). In second, audio data is processed on “block” structure basis. It means, having average of the block 50 dB, doesn’t mean that there was no spikes in the sampling pull, that obviously would be clipped and introduce error in the measurements results.  This phenomenon is defined as Crest Factor. Different sources estimate crest factor of musical content between 10 – 20 dB.  So, taking direct approach, Arduino with OPA mentioned above as front-end could accurately cover only:              50 – 20 = 30 dB.  To get wider dynamic range, I have to scale input amplifier gain, and this is exactly what I did, building amplifier in two stages and selecting one cascade (by-passing second one) or two cascades using internal ADC multiplexer. As there is no switching IC in analog signal path involved, gain is defined with high stability, could be one time precisely measured – calibrated via coefficient stored in EEPROM (nice feature to add).

On the right side there are electrical drawings of “slightly” modified kit,  where stereo amplifier was converted into 2 stage mono version. First stage, with gain about  G1 = 1 + 10 k / 1 k = 11  is necessary to “bump-up” line-level signal, to create DC bias required for correct operation of the ADC, and also served as buffer to lower signal source impedance, as it seen by ADC input.  I set a gain of the second stage amplifier at 40 dB:  20 x Log_10 ( G2 ),     where    G2 = 1 + 100 k / 1 k = 101.

IMHO, setting gain limit for only 30 db per stage as it follows from paragraph above, is overkill, and would be justified for “real-time” radio broadcasting or audio processing for storage media, when high fidelity of audio program must be preserved. For visual display “clipping” of bursts in signal is not noticeable at all due high refresh rate of display, 78 Hz. Human just can’t see, if LED lights-up with such speed.  For steady AC amplitude measurements (micro Voltmeter mode) this is not a problem at all, and headroom as small as 3 dB would be sufficient, leaving wide 47 dB per stage.

 Software

  There are two thresholds are defined in program, where switching between one or two stage amplification is happening:

      if ( magn_new <=  44 ) sensitv = 1;

      if ( magn_new >= 47 ) sensitv = 0;

  44 and 47, with hysteresis 3 dB. First line defines switching to high sensitive mode (overall gain 1100), and second line, does exactly opposite. Look at the chart, hope it would save me a million words -);

 Couple words on using this device as precise AC micro-voltmeter. Having 1100 overall amplification as add-up to already quite sensitive Arduino ADC, driving overall sensitivity to enormously  5 / ( 1024 x 1100 ) = 4.439 uV Special care should be taken on grounding, shielding of amplifier PCB, probably, EMI suppressor ferrite chokes wouldn’t be an excess in power line and signal path.   In my project, w/o any modification to original kit’s board (except couple jumper wires to cascade two stage amplifier) of course, I was not expecting to get to such high sensitivity level. Moreover, in project arduino is driving LED display, “ADC noise reduction mode” is off, plus ADC is working on double speed – preselector set to 250 kHz!!!  And this is why constant 14 was subtracted in software from magn_new, just before it goes for BarGraph “mapping” procedure:

      magn_new  -= 14;

Basically 14 is a noise flour of my analog front-end.  Approximately 51 micro volts AC is turning on first LED bar. Look at the table, which reflect my current hardware set-up.

* Other things to keep in mind, there is a “gap” 78 Hz wide in frequency range at 10 kHz,  It introduces a small error, about  78 / 20.000 = 0.39% in white noise measurements result. For musical content, which has really low power density level at 10 kHz, magnitude of error would be much lower, probably, less than 0.05 %.

 Running FFT in code creates great opportunity to reject any interference in the audio band. For example, if there is a noticeable hum from electrical grid lines in the content, issue easily could be fixed NOT including bin[1] in final sum of magnitude calculation. Though to make it works more efficient, some adjustment in sampling period would be necessary, setting bin[1] frequency precisely at 50/60 Hz.

 One more advantage of having FFT based  filtering     (primary mission is HPF, look in stereo VU meter, how long kernel of the FIR filter has to be otherwise), is great opportunity to create “weighting” A, B, C or D curve for audio noise measurements. (:TO DO).

 Link to Download Arduino sketch:  Audio_VU_Meter_Mono_69dB


**********Stereo Audio VU meter on Arduino**********

This blog is a sequel of “Tears of Rainbow”.  Using the same hardware set-up of Gigantic RGB LED display, I decided to re-work software a little bit, in order to display the true RMS amplitude of musical content. Video clip on youtube:                       VU_Meter   640×480                                      VU_Meter_HD

Objective:

  • Stereo input, process both channel;
  • Full audio band, 40 Hz – 20 kHz;
  • Fast update rate of visual output.
  • Precision Full-Wave  measurements. 

To process stereo input, this time arduino is switching ADC multiplexer every time when it finish sampling input data array (size=128). Two channels “interleaved” with frame rate 78 Hz, so during each frame only one channel sampled / processed, and update rate per channel is equals to 78 / 2 = 39 Hz, which is more than enough for most audio applications.

 I’m using FFT Radix-4  to extract RMS magnitude of audio waveform, and this is why:

1.  Sampling rate in this application is 10 kHz. How I achieved  20 kHz stated in objective section, doing sampling only 10 ksps?  >>>Aliasing!<<<   What is considered to be nightmare when we need spectral information from FFT output, aliasing in this project is really helpful, reflecting all spectral components around  axis – 10 kHz back “to the field”. As all bins going to be sum-up there is no issue, only benefits. Due aliasing, I’m able to use low sampling rate, and reduce CPU workload down to 52%.

2.  In order to get accurate magnitude calculation of RMS,  which is defined as square root of the sum of squares divided by number of samples per specified period of time:    V(rms) = √ ( ∑ Vi ^2 ) / N) DC offset  must be subtracted from the input raw data of each sample    Vi = Vac + Vdc   (if you remember, AtMega328 ADC needs DC offset to read AC negative half-wave).  The problem here, DC offset value is never known with high accuracy due bunch of reason, like voltage stability of PSU,  thermal effects, resistors tolerance (+/- 1 or 5 %), ADC internal non-linearity etc. Cure for this, which works quite well for monitoring electrical grid power, high pass filter (HPF). Only instead of single 50/60 Hz frequency of power line,  I have a wide frequency range, starting from 20 Hz and ending at 20 kHz. When I feed specification of the HPF:

  • Sample Rate (Hz) ? [0 to 20000]                     ? 10000
  • Desired stop-band attenuation (dB) [10 to 200] ? 40
  • Stop-band edge frequency Fa [0 to 5000]         ? 0
  • Pass-band edge frequency Fp [0 to 5000]        ? 40

to  Parks-McClellan FIR filter design algorithm (one of the most popular, and probably, the best) it provides the result:

  • …filter length: 551 …beta: 3.395321

551 coefficient to be multiplied and sum up (MAC-ed) every 100 usec! No way. I’m not sure, if it could be done on 32-bits 100 MHz platform with build-in MAC hardware, but there is no way for 8-bit 16 MHz Arduino.

IIR filter wouldn’t make much difference here. It has lower quantity of multiplications, but more sensitive for truncation and rounding error, so I’d have to use longer (32-bits?) variables, which is not desirable on 8-bit microprocessor at all.

And here comes FFT Radix-4, which easily fulfill this extra-tough requirements in the most efficient and elegant way. All I have to do, is just NOT include bin[0] in final sum, and all DONE!. TOP-FLAT  linear frequency response  40 Hz – 20 kHz  ( -3 dB ), with complete suppression of DC, and low frequency rumble below 20 Hz attenuation.  Linearity is better than +-1 dB between 80 – 9960 Hz.

Last things, audio front-end. As VU meter was designed in stereo version, I’ve build another “line-in”  pre-amplifier based on this kit: Super Ear Amplifier Kit

Link to Download a sketch:  Stereo_VU_Meter.


Modified Stereo VU meter, Logarithmic scale, 8 bars per channel, spacing 6 dB.

Dynamic range: 8 x 6 = 48 dB.  Stereo_VU_Meter(Log10).
 Next blog:   Extending dynamic range to 72 dB!