

EKG recording working
My son and I spent some time today debugging his data logger. I also convinced him to add some documentation, though not nearly as much as I think is needed. This version is just a text command interface, with no GUI—the PyGUI interface he was building seemed to slow things down a lot, and is not yet ready for use.
The data logger works fine as long as the sampling interval is at least 3msec. With 2msec sampling, I think that serial communications (over a 115200 baud USB serial connection) is getting overwhelmed. The Arduino seems to be capable of sending out data ok at 2msec/sample, though 1msec/sample causes it to miss some timer interrupts.
If the Python program can’t empty the serial port fast enough, I think that there operating system problems. My MacBook Pro sometimes gets wedged with long runs at higher sampling rates—I’ve had to reboot it a couple of times today. If the problem is with the MacBook Pro, it may be possible to run with slightly shorter sampling intervals on faster hosts, before hitting the limits of the Arduino.
I did manage to get a nice recording for about 8.5 seconds at 3msec sampling:
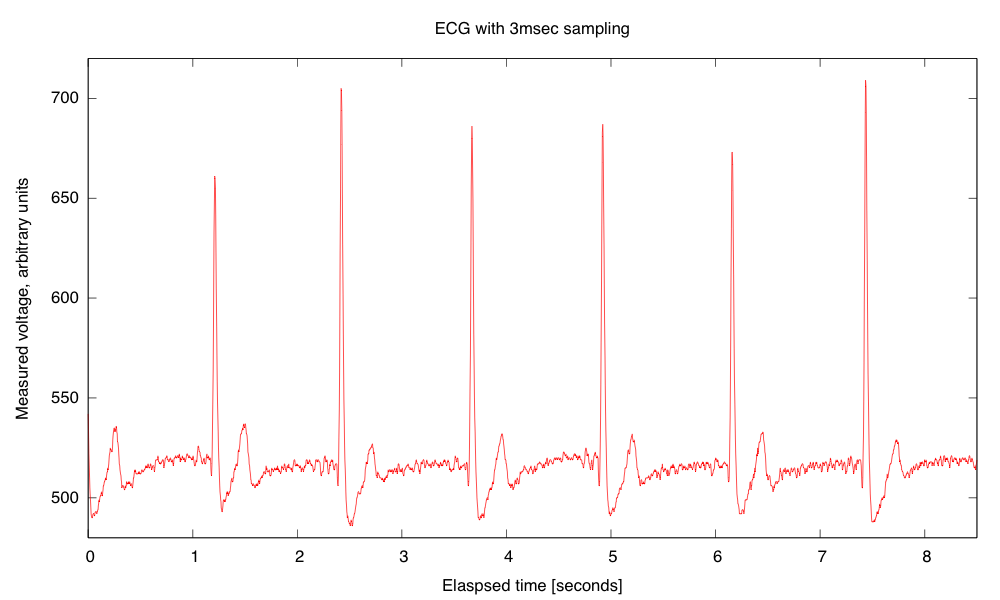
Recording of EKG trace on the Arduino. The value 512 represents the midpoint of the Arduino voltage scale. The EKG circuit and Arduino used separate power supplies, so the reference voltage is about 2.506V, while AREF on the Arduino was 4.96V, so the reference voltage should be about 517. In a separate recording of the EKG signal and Vref, I found Vref to be 515±1. The arbitrary units are about 4.844mV at the input to Arduino. If my gain of my EKG is set to 591 as I expect from the resistor values, the arbitrary units should correspond to 8.2µV at the electrodes, and the biggest peak is about +1.6mV and the deepest drop is about -0.24mV.
I think that the signals were clearer today, because I was using a ground electrode on my chest, rather than on my elbow, reducing the common-mode noise a little. The 3msec resolution allows zooming in to get a pretty clear view of the structure of the pulses:
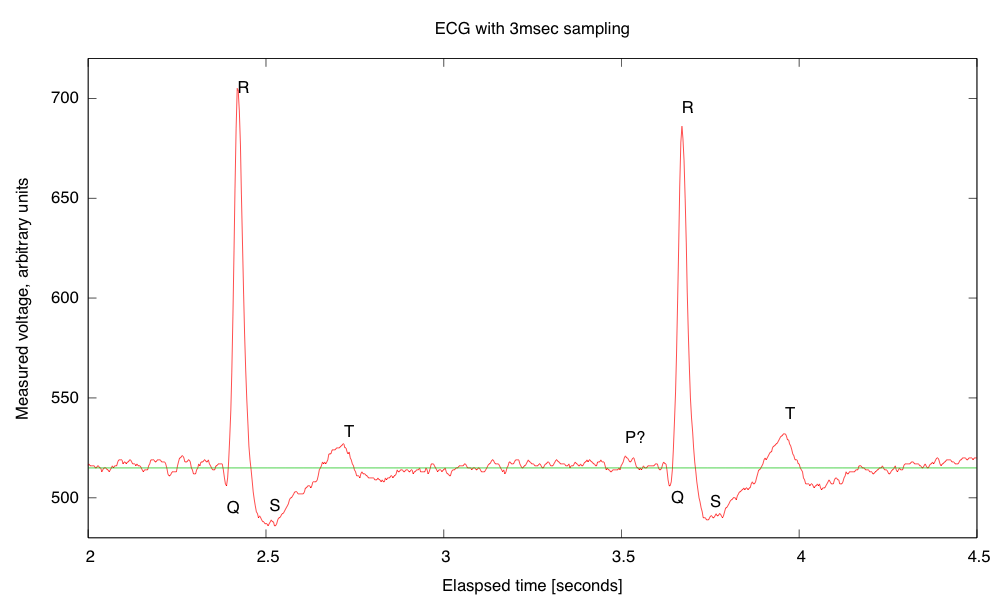
Detail of a couple of pulses showing the QRS complex and the T pulse. I’m not sure whether or not a P pulse is visible—if so it is almost buried in the noise. I’ve added a line where I believe that the reference voltage is, though it was not recorded on this run. The R-R interval here is about 1251±2msec for a pulse of 0.80 Hz or 48.0 bpm, which is about my usual resting pulse.
Although it took my son and me a little debugging to get everything working today, overall I’m quite pleased with the data logger code he wrote. He still has more documentation to add (both in-code and external), and there are some more features that could be added, but it is basically usable as is.
Incidentally, I found out today from Cardiology Explained by E.A. Ashley and J. Niebauer, that
ECG terminology has two meanings for the word “lead”:
- the cable used to connect an electrode to the ECG recorder
- the electrical view of the heart obtained from any one combination of electrodes
So it is not surprising that I was confused by the usage—I was only familiar with the first usage, which corresponds to normal engineering terminology.
Filed under: Circuits course, Data acquisition Tagged: Arduino, bioengineering, circuits, course design, ECG, EKG, electrocardiogram, instrumentation amplifier, op amp


[original story: Gas station without pumps]