Learn how to use an inexpensive TFT colour touch LCD shield with your Arduino. This is chapter twenty-nine of our huge Arduino tutorial series.
Updated 07/02/2014
There are many colour LCDs on the market that can be used with an Arduino, and in this tutorial we’ll explain how to use a model that is easy to use, has a touch screen, doesn’t waste all your digital output pins – and won’t break the bank. It’s the 2.8″ TFT colour touch screen shield from Tronixlabs:

And upside down:

As you can imagine, it completely covers an Arduino Uno or compatible board, and offers a neat way to create a large display or user-interface. The display has a resolution of 320 x 240 pixels, supports up to 65536 colours and draws around 250mA of current from the Arduino’s internal 5V supply.
And unlike other colour LCDs, this one doesn’t eat up all your digital output pins – it uses the SPI bus for the display (D10~D13), and four analogue pins (A0~A3) if you use the touch sensor. However if you also use the onboard microSD socket more pins will be required.
With some imagination, existing Arduino knowledge and the explanation within you’ll be creating all sorts of displays and interfaces in a short period of time. Don’t be afraid to experiment!
Getting started
Setting up the hardware is easy – just plug the shield on your Arduino. Next, download the library bundle from here. Inside the .zip file is two folders – both which need to be copied into your …\Arduino-1.0.x\libraries folder. Then you will need to rename the folder “TFT_Touch” to “TFT”. You will notice that the Arduino IDE already contains a library folder called TFT, so rename or move it.
Now let’s test the shield so you know it works, and also to have some quick fun. Upload the paint example included in the TFT library – then with a stylus or non-destructive pointer, you can select colour and draw on the LCD – as shown in this video. At this point we’d like to note that you should be careful with the screen – it doesn’t have a protective layer.
Afraid the quality of our camera doesn’t do the screen any justice, however the still image looks better:

Using the LCD
Moving on, let’s start with using the display. In your sketches the following libraries need to be included using the following lines before void setup():
#include <stdint.h>
#include <TFTv2.h>
#include <SPI.h>
… and then the TFT library is initialised in void setup()
Tft.TFTinit();
Now you can use the various functions to display text and graphics. However you first need to understand how to define colours.
Defining colours
Functions with a colour parameter can accept one of the ten ten predefined colours – RED, GREEN, BLUE, BLACK, YELLOW, WHITE, CYAN, BRIGHT_RED, GRAY1 and GRAY2, or you can create your own colour value. Colours are defined with 16-but numbers in hexadecimal form, with 5 bits for red, 6 for green and 5 for blue – all packed together. For example – in binary:
MSB > RRRRRGGGGGGRRRRR < LSB
These are called RGB565-formatted numbers – and we use these in hexadecimal format with our display. So black will be all zeros, then converted to hexadecimal; white all ones, etc. The process of converting normal RGB values to RGB565 would give an aspirin a headache, but instead thanks to Henning Karlsen you can use his conversion tool to do the work for you. Consider giving Henning a donation for his efforts.
Displaying text
There are functions to display characters, strings of text, integers and float variables:
Tft.drawChar(char, x, y, size, colour);          // displays single character variables
  Tft.drawString(string, x, y, size, colour);      // displays arrays of characters
  Tft.drawNumber(integer, x, y, size, colour);     // displays integers
  Tft.drawFloat(float, x, y, size, colour);        // displays floating-point numbers
In each of the functions, the first parameter is the variable or data to display; x and y are the coordinates of the top-left of the first character being displayed; and colour is either the predefined colour as explained previously, or the hexadecimal value for the colour you would like the text to be displayed in – e.g. 0xFFE0 is yellow.
The drawFloat() function is limited to two decimal places, however you can increase this if necessary. To do so, close the Arduino IDE if running, open the file TFTv2.cpp located in the TFT library folder – and search for the line:
INT8U decimal=2;
… then change the value to the number of decimal places you require. We have set ours to four with success, and the library will round out any more decimal places. To see these text display functions in action, upload the following sketch:
#include <stdint.h>
#include <TFTv2.h>
#include <SPI.h>

char ascii = 'a';
char h1[] = "Hello";
char h2[] = "world";
float f1 = 3.12345678;

void setup()
{
  Tft.TFTinit();
}

void loop()
{
  Tft.drawNumber(12345678, 0, 0, 1, 0xF800);
  Tft.drawChar(ascii,0, 20,2, BLUE);
  Tft.drawString(h1,0, 50,3,YELLOW);
  Tft.drawString(h2,0, 90,4,RED);
  Tft.drawFloat(f1, 4, 0, 140, 2, BLUE);
}
… which should result in the following:

To clear the screen
To set the screen back to all black, use:
Tft.fillScreen();
Graphics functions
There are functions to draw individual pixels, circles, filled circles, lines, rectangles and filled rectangles. With these and a little planning you can create all sorts of images and diagrams. The functions are:
Tft.setPixel(x, y, COLOUR);
// set a pixel at x,y of colour COLOUR

Tft.drawLine(x1, y1, x2, y2, COLOUR);
// draw a line from x1, y1 to x2, y2 of colour COLOUR

Tft.drawCircle(x, y, r, COLOUR);
// draw a circle with centre at x, y and radius r of colour COLOUR

Tft.fillCircle(x, y, r, COLOUR);
// draw a filled circle with centre at x, y and radius r of colour COLOUR

Tft.drawRectangle(x1, y1, x2, y2 ,COLOUR);
// draw a rectangle from x1, y1 (top-left corner) to x2, y2 (bottom-right corner) of colour COLOUR

Tft.Tft.fillRectangle(x1, y1, x2, y2 ,COLOUR);
// draw a filled rectangle from x1, y1 (top-left corner) to x2, y2 (bottom-right corner) of colour COLOUR
The following sketch demonstrates the functions listed above:
#include <stdint.h>
#include <TFTv2.h>
#include <SPI.h>

int x, y, x1, x2, y1, y2, r;

void setup()
{
  randomSeed(analogRead(0));
  Tft.TFTinit();
}
void loop()
{
  // random pixels
  for (int i=0; i<500; i++)
  {
    y=random(320);
    x=random(240);
    Tft.setPixel(x, y, YELLOW);
    delay(5);
  }
  delay(1000);
  Tft.fillScreen(); // clear screen

    // random lines
  for (int i=0; i<50; i++)
  {
    y1=random(320);
    y2=random(320);
    x1=random(240);
    x2=random(240);
    Tft.drawLine(x1, y1, x2, y2, RED);
    delay(10);
  }
  delay(1000);
  Tft.fillScreen(); // clear screen

    // random circles
  for (int i=0; i<50; i++)
  {
    y=random(320);
    x=random(240);
    r=random(50);
    Tft.drawCircle(x, y, r, BLUE);
    delay(10);
  }
  delay(1000);
  Tft.fillScreen(); // clear screen

    // random filled circles
  for (int i=0; i<10; i++)
  {
    y=random(320);
    x=random(240);
    r=random(50);
    Tft.fillCircle(x, y, r, GREEN);
    delay(250);
    Tft.fillCircle(x, y, r, BLACK);
  }
  delay(1000);
  Tft.fillScreen(); // clear screen

    // random rectangles
  for (int i=0; i<50; i++)
  {
    y1=random(320);
    y2=random(320);
    x1=random(240);
    x2=random(240);
    Tft.drawRectangle(x1, y1, x2, y2, WHITE);
    delay(10);
  }
  delay(1000);
  Tft.fillScreen(); // clear screen

    // random filled rectangles
  for (int i=0; i<10; i++)
  {
    y1=random(320);
    y2=random(320);
    x1=random(240);
    x2=random(240);
    Tft.fillRectangle(x1, y1, x2, y2, RED);
    delay(250);
    Tft.fillRectangle(x1, y1, x2, y2, BLACK);
  }
  delay(1000);
  Tft.fillScreen(); // clear screen
}
… with the results shown in this video.
Using the touch screen
The touch screen operates in a similar manner to the other version documented earlier, in that it is a resistive touch screen and we very quickly apply voltage to one axis then measure the value with an analogue pin, then repeat the process for the other axis.
You can use the method in that chapter, however with our model you can use a touch screen library, and this is included with the library .zip file you downloaded at the start of this tutorial.
The library does simplify things somewhat, so without further ado upload the touchScreen example sketch included with the library. Open the serial monitor then start touching the screen. The coordinates of the area over a pixel being touch will be returned, along with the pressure – as shown in this video.
Take note of the pressure values, as these need to be considered when creating projects. If you don’t take pressure into account, there could be false positive touches detected which could cause mayhem in your project.
Now that you have a very simple method to determine the results of which part of the screen is being touched – you can create sketches to take action depending on the touch area. Recall from the example touch sketch that the x and y coordinates were mapped into the variables p.x and p.y, with the pressure mapped to p.z. You should experiment with your screen to determine which pressure values work for you.
In the following example, we don’t trigger a touch unless the pressure value p.z is greater than 300. Let’s create a simple touch-switch, with one half of the screen for ON and the other half for OFF. Here is the sketch:
#include <stdint.h>
#include <TFTv2.h>
#include <SPI.h>
#include <TouchScreen.h>

// determine the pins connected to the touch screen hardware
// A0~A3
#define YP A2   // must be an analog pin, use "An" notation!
#define XM A1   // must be an analog pin, use "An" notation!
#define YM 14   // can be a digital pin, this is A0
#define XP 17   // can be a digital pin, this is A3

#define TS_MINX 116*2
#define TS_MAXX 890*2
#define TS_MINY 83*2
#define TS_MAXY 913*2

// For better pressure precision, we need to know the resistance
// between X+ and X- Use any multimeter to read it
// The 2.8" TFT Touch shield has 300 ohms across the X plate
TouchScreen ts = TouchScreen(XP, YP, XM, YM);

void setup()
{
  Serial.begin(9600);
  Tft.TFTinit();
  Tft.fillScreen(); // clear screen
}

void loop()
{
  // a point object holds x y and z coordinates
  Point p = ts.getPoint();
  p.x = map(p.x, TS_MINX, TS_MAXX, 0, 240);
  p.y = map(p.y, TS_MINY, TS_MAXY, 0, 320);
  Serial.println(p.y);
  if (p.y < 160 && p.z > 300) // top half of screen?
  {
    // off
    Tft.fillCircle(120, 160, 100, BLACK);
    Tft.drawCircle(120, 160, 100, BLUE);
  } else if (p.y >= 160 && p.z > 300)
  {
    // on
    Tft.fillCircle(120, 160, 100, BLUE);
  }
}
What’s happening here? We divided the screen into two halves (well not physically…) and consider any touch with a y-value of less than 160 to be the off area, and the rest of the screen to be the on area. This is tested in the two if functions – which also use an and (“&&”) to check the pressure. If the pressure is over 300 (remember, this could be different for you) – the touch is real and the switch is turned on or off.
… and a quick demonstration video of this in action.
Displaying images from a memory card
We feel this warrants a separate tutorial, however if you can’t wait – check out the demo sketch which includes some example image files to use.
Conclusion
By now I hope you have the answer to “how do you use a touch screen LCD with Arduino?” and had some fun learning with us. You can get your LCD from Tronixlabs. And if you enjoyed this article, or want to introduce someone else to the interesting world of Arduino – check out my book (now in a third printing!) “Arduino Workshop”.

Have fun and keep checking into
tronixstuff.com. Why not follow things on
twitter,
Google+, subscribe for email updates or RSS using the links on the right-hand column, or join our
forum – dedicated to the projects and related items on this website.
Sign up – it’s free, helpful to each other – and we can all learn something.
The post Tutorial – Arduino and TFT Color Touch Screen appeared first on tronixstuff.


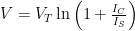


 , where IS is the saturation current of the diode:


