

I-vs-V plots for base-emitter diodes
Earlier today I posted a voltage-versus-current curve for a 1N5817 Schottky diode, to confirm the theoretical formula 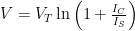
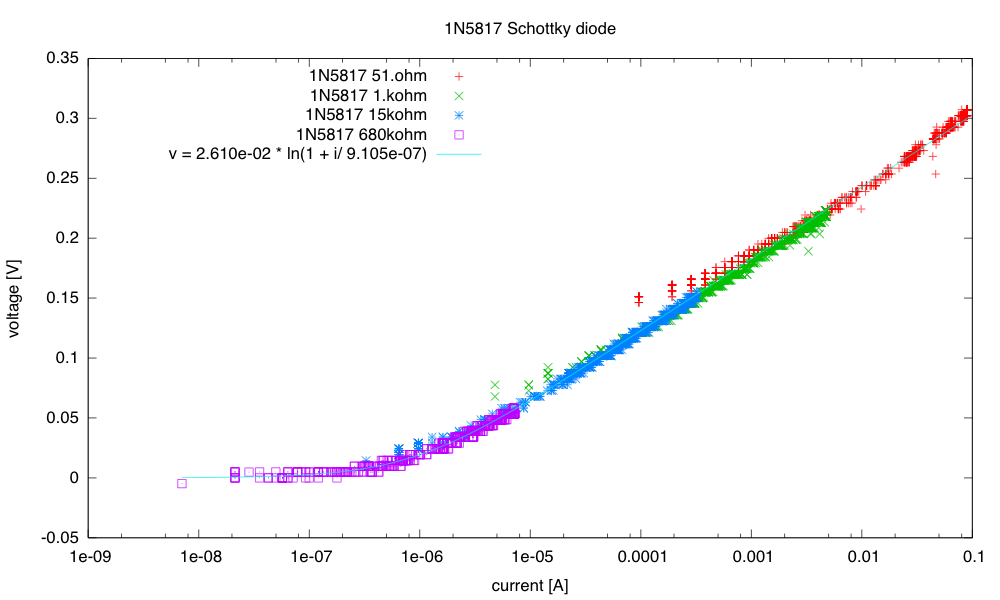
Fitting over a wide range of currents is more robust than fitting over the narrower range that I can get with just one value for R2.
There is quantization error still on the voltages, but the overlapping current ranges give good data for most of the range. VT is now 26.1mV and IS is 0.91µA.
I also said that I should characterize the base-emitter junction of a PNP and an NPN transistor this way also, for setting the appropriate resistances for the log amplifier in the loudness circuit. I did that this evening for the S9012 PNP and S9013 NPN transistors:

Base-emitter diode for the S9012 PNP transistor (collector and base connected together). VT is 25.3mV and ISO is 13.4fA.

Characteristics for the base-emitter diode of the S9013 NPN transistor (collector and base connected together). VT is 25.5mV and ISO is 8.85fA.
For both transistors, the region where the logarithmic fit is good is from about 0.5µA to about 50mA (maybe only 35mA for the NPN transistor). That gives about a 100dB working range for a log amplifier, if the largest current corresponds to 50mA. Of course, the op amps that are driving the input of the log amplifier don’t have that much drive capability, and we are probably limited to about 20mA—only a 90dB dynamic range on the log amplifier.
Filed under: Circuits course, Data acquisition Tagged: Arduino, bipolar transistors, i-vs-v-plot, log amplifier


[original story: Gas station without pumps]
 , where IS is the saturation current of the diode:


