Posts with «circuits» label

Fourth day of circuits class

Today’s class went much better than last Friday’s.

I took the advice one of the students gave me last we and started with a “do now” question.  (She had actually suggested an “exit ticket”, but I don’t have the time management skills to leave a block of time at the end of class.)  The question I asked was a design task that was easy if you knew what you were doing, but subtly harder than the standard sort of text-book question, because it was a design question, not an analysis question:

You have sensor whose resistance varies from 1kΩ to 4kΩ with the property it measures.  Design a circuit whose output voltage varies from 1v (at 1kΩ) to 2v (at 4kΩ).

I gave the students 10 minutes to work on this at the beginning of class.  A good question to prompt discussion (according to the peer instruction blogs and websites) should be answerable by 30–80% of the students.  More than that and the question was too easy to be useful, and less than that and the question is too hard for peer discussion to be worthwhile.  It turned out that no one had gotten it after 10 minutes (too hard to use as a peer instruction question), so we used it as the basis for a class discussion.

Almost everyone realized that the desired circuit was a voltage source and a voltage divider (not too surprising, since that’s the only circuit they’ve used so far).  The majority also realized that the variable resistor had to be on the lower leg, between the output and ground, and a couple of the students could articulate why.  I suggested the common heuristic of trying extreme values (0 and ∞) for the variable resistor, to see whether the output voltage would go up or down as the resistance changed.

The students were then able to set up the simultaneous equations to solve for the input voltage and the fixed resistance.  The hole in everyone’s thinking when working on the problem initially is that they had not considered the voltage of the source as a design parameter to solve for, though one student had asked about it. This was the blind spot I was expecting, so I was able to use it as a teachable moment.  After we had the equations set up using mainly student input, I gave the students another minute or two to solve them, and about half the class was able to solve them correctly in the time provided. (I suspect that everyone could have if given enough time, but I didn’t want to take any more time in class—those who didn’t solve it in class could practice their algebra at home if they needed to.)  One student had made an algebra or arithmetic mistake, and gotten a source voltage smaller than one of the desired output voltages.  This was also a good mistake to get, since we could use it to talk about sanity checks on results.

I think that the 20 or so minutes of class was well spent, as we uncovered several important misconceptions, and raised awareness of all unspecified variables as potential design parameters, reasoning using extreme values, and the usefulness of sanity checks.

After that, we spent some time discussing different temperature sensors.  From the students, I got thermistor, infrared thermometer, mercury thermometer+camera, and enzyme + other sensor (pH, conductivity, color, …). I added RTD, silicon band-gap, and thermocouple to the mix.  We talked a little about the advantages and disadvantages of each. At the end, I also threw in bimetallic strips and tilt switches for one-bit digitization of temperature.  I wonder how many students will look at the thermostats in their apartments and try to figure out what sensor they include.

For the remainder of the class, we talked about gnuplot commands, particularly the “plot” command.

After class, several of us went over to the lab, where my son met us and helped the students install the DataLoger, python, pyserial, the Arduino environment, and gnuplot.  While he was doing that, I borrowed an Uno R3 Arduino board and made sure that all the computers in the labs had the drivers installed for it.  We had 2 installation failures: on one Windows laptop, my son was unable to get the serial ports to work and one Mac laptop couldn’t install gnuplot.

The problem with the gnuplot installation on that Mac was not solvable by the techniques in the comments for Installing gnuplot—a nightmare, because all the methods there assume that you can install the command-line tools “make” and “gcc”.  The Mac had 10.6.8 installed, but the student had never bothered to install the development tools and had lost the original CD-ROM with the Xcode tools on it.  The Apple Developer site does not provide the command-line tools for anything older than 10.7.3.  The only workaround we could find was to download the 4.1GByte complete Xcode suite for OS 10.6.8, which I was not willing to wait around for. (Other students with 10.6.8 had no trouble installing gnuplot, because they already had the command-line tools, though they’d never used them.)

I did not look at the problem on the Windows machine (the student had to leave for class before I became available), but I don’t know that I could have done anything—my son knows more about Windows than I do, so if he was stuck, I probably would have been also.

Next year I’m going to want to do an install session before the first lab.  (Or, if we go to 2 labs a week, as the first lab.)

On Wednesday, I’ll start with another “do now” question, though I’m not sure what it’ll be on, since I’ve not yet gotten to the material for this week’s lab: how a microphone works. I’ll do a tiny bit of gnuplot (just the “fit” command) and try to get through how a microphone works and an idealized i-vs-v plot for the FET output of the microphone.


Filed under: Circuits course Tagged: Arduino, circuits, gnuplot, parts, teaching, temperature measurement, voltage divider

Data logging software for circuits course working

Over winter break, my son has been working nearly full time on writing data logging software for my students to use in the Applied Circuits for Bioengineers course. He has made the first public beta release (v1.0.0b1) today on BitBucket. (Note: you may have to click on the “tags” tab to get to the view that shows the v1.0.0b1 link. The BitBucket link directly to that view seems to be broken—that’s open issue 5504 in BitBucket’s own issue tracker.)

We’ve only tested the code on Mac OS X computers with Arduino Duemilanove and Uno boards, though we’ve tested a slightly earlier version on Windows.  The code should also run on Linux and with Leonardo and Mega boards, but has not been tested on these platforms. We welcome users testing the code for us—report any problems using the BitBucket issue tracker for the project.  The documentation is still in a fairly primitive state—report issues with that also, so that they can be fixed.

The overall goal is fairly simple: to have an easy-to-use way to record timestamps, voltages, and digital values from the Arduino into files on a host computer, without needing auxiliary hardware (like the Adafruit data logger shield that I bought for myself and assembled yesterday).

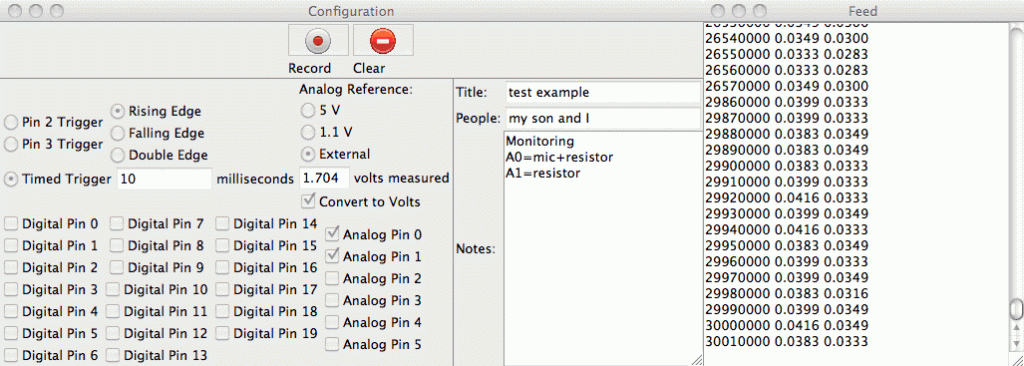
The user can specify what analog and digital pins to record and when to record the values.  When to record can be specified either   as interrupts on pins or as fixed timing intervals:

View of the two windows of the user interface.

The “volts measured” for the reference is stored as metadata in the output file and can be used for scaling the Arduino numbers (if “Convert to Volts” is checked).  The scaling can be an arbitrary value for the full-scale reading or can be the voltage measured with an external multimeter at the AREF pin.

This software has been through several versions:

  1. The first version of the code was one I wrote last spring that just recorded interrupt times in an Arduino array and dumped them out over the USB cable after it was done (see Homemade super pulley).
  2. My son was not happy with that crude program of mine and rewrote it in June to have use the Arduino memory as a queue and send the time stamps to a Python program on the laptop (see Improved super pulley code).  That program introduced him to three new concepts: circular buffers for queues, interrupts, and multi-threading, all of which he researched for himself. That version of the code mainly used a command line interface, but he used the curses package for a crude user interface.
  3. He added a PyGUI graphical user interface, but that slowed down the code on the laptop and eventually grew to be difficult to maintain.
  4. He decided to try to make the software by portable between three platforms (Mac OS X, Windows, and Linux) despite their very different ways of dealing with the USB serial ports, to run under both Python2.7 and Python3, and to require only minimal non-standard packages (mainly PySerial and the Arduino package Timer1).  He refactored the code completely and built the GUI using Tkinter. This has lead to the current version of the code, which is finally working robustly enough to let the bioengineering students use it.

It has been a good software-engineering experience for my son, and he has learned a lot.  In the process of developing this code, he has learned a lot about interrupts, using queues to communicate between processors and between threads, platform-independence, a couple of different GUI libraries, the value of version control and bug-tracking, race conditions, interface design for non-expert users, and even some things about documentation.

I’ve been acting mainly as a customer for this code, entering bug reports and suggesting new features, though I have occasionally helped him debug.  For example, we just spent fifteen minutes reading Section 15 “16-bit Timer/Counter1 with PWM” of the ATMega328 data sheet, trying to figure out why the first time interval was wrong.  It turns out that timer interrupt is raised immediately when the interrupt is enabled, unless the timer-overflow flag is turned off first.

My son may use this project as a science fair entry this year, though it was not started with that idea, and we discussed that possibility for the first time today.  The big problem is that this is purely an engineering project, not a “science” project, and trying to fake a hypothesis is not something we’ll consider.


Filed under: Circuits course, Data acquisition, home school, Science fair Tagged: Arduino, bioengineering, BitBucket, circuits, data logger

Three lab handout drafts done

On Tuesdays, my son and I usually have our weekly physics class, but in deference to the national holiday on Dec 25th we canceled this week’s class. I spent the day preparing drafts of lab handouts for the first three labs in the circuits course. The handouts are taking longer to produce than I expected, and they are coming out longer than expected also.  I’ll post links to the lab pages once they are past the draft stage—I’m hoping to get feedback from my co-instructor by next week.

  1. The draft for the first (thermistor) lab is 10 pages, and still is missing pictures and a couple of paragraphs of text, particularly about using the data logger that my son is still writing for the students in the course to use.
  2. The draft for the second (microphone) lab is 5 pages, and still doesn’t explain how to use an oscilloscope. We have both analog and digital scopes in the lab, and the analog ones a pretty easy to learn to use, but the Tektronix digital scopes have a very confusing menu interface that takes a long time to become familiar with. I still have to check out whether the function generators in the lab can drive a loudspeaker, as I’m expecting the students to be able to play sine waves into the microphones.
  3. The draft for the third (electrodes) lab is also 5 pages, but it is looking fairly complete to me.

I’ve posted a tentative schedule for the 10 labs of the quarter, http://courses.soe.ucsc.edu/courses/bme194/Winter13/01/schedule:

  1. Thermistor lab
  2. Microphone lab
  3. Electrodes lab
  4. Sampling and aliasing lab
  5. Audio amplifier lab 1 (op amps)
  6. FET measurement lab, phototransistor measurement lab
  7. Audio amplifier lab 2 (power amp)
  8. Hysteresis lab (capacitive touch sensor, 1st soldering project)
  9. Pressure sensor lab (instrumentation amp, soldering)
  10. EKG lab

There is a little more measurement and less design content than I had wanted in the first half of the course—I’ve only come up with fairly trivial design exercises until we get to amplifiers, and then the designs get much harder.  I’m still trying to come up with a design lab for the phototransistors—right now I’m just looking a characterizing an LED and phototransistor pair for use as an optoisolator, with appropriate biasing for each to transfer analog signals (digital signals are too easy).  The students will have 3 LEDs (green, red, and infrared), so we could also look at the signal levels with each, to see whether the infrared emitter provides a better signal.

I don’t really know exactly what is in the sampling and aliasing lab, which my co-instructor created for a different course.  I’ll have to get his handouts for it, and type them up in the format I’m using for this course.  I’ll probably have to borrow a board from him also, to run through the lab myself.  It was probably designed as a 2-hour lab, not a 3-hour one, so I may want to add a bit to it.

The Digikey order for parts shipped today, the last on-line order I made, and it looks like the cost per student will be between $65 and $66 for tools and parts (see Parts orders for Applied Circuits W13 for more details on the pricing).  I still have to make a packing list for each kit, and put the kits together.  I hope that all the orders arrive by the middle of next week, so that we can distribute the parts kits on Wednesday 2013 Jan 9.

I also hope I’ll be able to package the kits in 1-gallon ZipLock bags—I’m beginning to think I might need to leave the loudspeakers separate, and that it will still be a tight fit. ZipLock does make bigger bags: 3 gallon, 10 gallon, and 20 gallon), but at $1.18 each for the 3-gallon bags, I’d rather not go there—even 40¢ each for the 2-gallon bags is a bit high.

I’ve also been thinking of getting an Arduino Leonardo for testing my son’s DataLogger code, as the Leonardo has a different serial interface and a different number of analog and digital pins available: 20 I/O pins, of which 7 can be configured for PWM and 12 as analog inputs though 3 of those are also PWM pins, as opposed to the 20 I/O pins of the Uno, 6 of which can be configured for PWM and 6 as analog inputs.  There are several other incompatibilities (like where the TWI interface and that the Leonardo does not reset when the serial connection is first opened as on all previous Arduino boards).  Designing shields for Arduino boards has gotten much more complicated lately, as Arduino has proliferated a number of incompatible interfaces.  I think that this might hurt them in their main market.  I’m wondering it the Raspberry Pi is cheap enough, available enough, and easy enough to interface and program to edge out Arduino in the next few years.  I have some Raspberry Pi boards now, and when I get some time I’ll want to try playing with them.


Filed under: Circuits course, Raspberry Pi Tagged: Arduino, circuits, course design, lab exercises, Raspberry Pi

Tested Python and Arduino installation

My son and I bicycled up to campus today to test out his data logger code (that will be used in the circuits course) on the Windows computers in the lab.  The lab support staff had told me yesterday that they had gotten Python 2.7.3 installed and the Arduino 1.0.3 development environment, as well as the PySerial module that the data logger code requires.

My son has been working pretty intensely on the code lately, doing a complete refactoring of the code to use TKinter (instead of PyGUI, which is difficult to install and quite slow) and to have a more user-friendly GUI.  He also wanted to make the code platform independent (Windows, Mac, and Linux), though he’d only tested on our Macs at home before today.  He’s also trying to make the Python part of the code (the user interface) work in both Python 2.7.3 and Python 3.3, though the languages are not precisely compatible.

We found three problems today:

  1. Python 2.7.3 was not quite completely installed.  They’d forgotten to update the path to include C:\Python27\  (The path should also include where the Arduino software was installed—I forget where that was now.)
  2. The device drivers for the Arduinos were not installed.  On Macs, there are no drivers to install, but on Windows, you need different drivers for different Arduino boards, and it seems you need to have the board plugged into the USB port in order to install the drivers. (Instructions at http://arduino.cc/en/Guide/Windows#t0c4)
  3. My son had forgotten to include one of the dependencies in his list of what needed to be installed—the Arduino Timer1 module from http://playground.arduino.cc/code/Timer1/ .

Because they had given me administrator privileges on the machines, my son was able to fix one of the machines to run the data logger code (though he had a couple of minor changes to make in his code for Windows compatibility also).

For the data logger debugging, about all I did was type in my password for him, and once do a search to see where the Arduino code was hidden.

When he has finished debugging and documenting the code, my son will be releasing it with a permissive license on bitbucket, and I’ll be putting links to it here and on the course web page.


Filed under: Circuits course, Data acquisition Tagged: Arduino, circuits, data logger, Python

Hysteresis board

Now that we’re using a 74HC14 Schmitt trigger in the capacitive touch sensor for the hysteresis oscillator, that lab can be the first soldering project, in addition to learning about hysteresis.

I tried laying out a very compact PC board for the students to solder (still requiring them to do some design—they’ll have to breadboard their design first to get appropriate R and C values). I came up with one very compact design that could get 4 copies into the 50mm×50mm limit of the $1 boards from ITEAD, making the boards only 25¢ each.

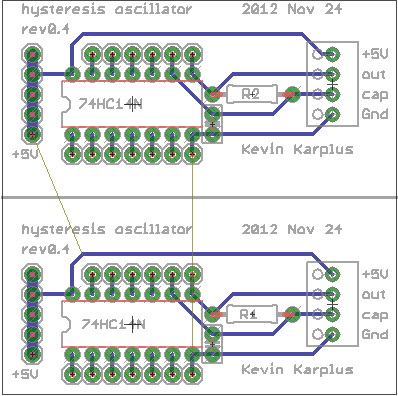
Compact layout to get 4 hysteresis oscillator boards out of one 50mm×50mm board. The gutters are pretty narrow, though, and I’m not sure I’m skillful enough with the board shears to cut that accurately.  The yellow “airwires” are Eagle telling me that the Gnd and +5V wires are not connected between the different copies.

It seemed a little silly to try to squeeze the price down to 25¢, when the other parts cost 90¢: 59¢ for the screw terminals, 28¢ for the Schmitt trigger chip, 1¢ for the resistor, and 2¢ for the capacitor. With this layout it is also a little tricky for the students to properly wire the unused inputs high.

Given the high risk of ruining the boards trying to cute them with the board shears, I decided to redesign for a 50¢ board.

Much looser layout, having only two copies on the 50mm x 50mm board. This version makes it easier for the students to see how things are connected, and has lots of room for the board shears to make the cut.

The lab would now require that the students measure the thresholds of the Schmitt trigger, breadboard the hysteresis oscillator, make a touch pad out of foil and packing tape, measure the frequency of the oscillation to estimate the touch pad capacitance, adjust the parameters of the Arduino program to match the frequencies of their oscillator, solder up the board, and demonstrate it working to control an LED. I think that is plenty for a 3-hour lab.

When I set up the web pages for the course, I’ll try to make sure I put the Eagle design files (.brd and .sch) for each board the students use on the web, so that future instructors can easily order more copies of the board, even if my laptop gets run over by a beer truck.  That will also make it easier for instructors at other schools to try to duplicate the course.


Filed under: Circuits course, Printed Circuit Boards Tagged: Arduino, bioengineering, capacitive touch sensor, circuits, course design, Printed circuit board, Schmitt trigger, sensors, teaching

Glockentar: Epic Instrument Mashup

What happens when you want to play two instruments at the same time, but only have two hands? You let electronics do the work for you, of course.

Read the full article on MAKE

Hysteresis lab

Schmitt-trigger oscillator.

Since I decided in Capacitive sensing with Schmitt trigger to use an off-the-shelf Schmitt trigger chip (like a 74HC14) and a very simple oscillator, I needed to rethink the lab and expand it.  Students will no longer be spending much time on building the circuit, so we need to play with other uses for the oscillator circuit and other applications of Schmitt triggers.

The Schmitt trigger is a useful device for students to learn about, since hysteresis is an important concept in detecting signals.  Probably the first thing to have them do is to use the oscilloscope in x-y mode to see the Vout vs. Vin curve for the Schmitt trigger inverter. It would be good for them to devise a way to measure the threshold voltages accurately (with their lab writeup describing both the method used and the thresholds measured), using the equipment they have available.  Perhaps bonus points for methods that don’t require any of the bench equipment? (There are some fairly easy methods using the Arduino for voltage measurements, though precision would be limited to about 5mV.)

After characterizing the inverter, they should design and measure one-inverter oscillators for different frequencies, using different combinations of resistors and capacitors (some low-resistance, high-capacitance designs and some high-resistance, low-capacitance designs).  They should show computations for the frequency using the threshold voltages and the R and C values.  It might be worthwhile to have them estimate the parasitic capacitance of the input to the Schmitt trigger (together with the wiring).

Then they should measure capacitance by hooking up an unknown capacitor with a known resistance, measuring the frequency, and computing the capacitance.  We would have to make up some unknowns with a wide range of different values.

Finally, they should make a capacitive touch pad (a piece of aluminum foil covered with a layer of packing tape). I’ve decided that I like foil covered with packing tape better than foil wrapped in plastic wrap.  The tape may be a bit thicker, but the lack of an air bubble makes for a much more repeatable capacitance, and it is less likely to fall apart when handled.

They should use the oscillator frequency to estimate the capacitance of both the plain pad and the pad when touched by a finger.  After observing the oscillator output on the oscilloscope they should adjust the parameters of a simple hysteresis program to turn an LED on and off with the touch sensor so that a firm touch is needed to light the LED and it doesn’t flicker with a light touch:

void setup(void)
{  pinMode(2,INPUT);
   pinMode(13,OUTPUT);
}

void loop(void)
{   digitalWrite(13, LOW);
    while (pulseIn(2,HIGH) <= 60) {}
    digitalWrite(13, HIGH);
    while (pulseIn(2,HIGH) >= 45) {}
}


Filed under: Circuits course Tagged: Arduino, bioengineering, capacitive touch sensor, circuits, course design, Schmitt trigger, sensors, teaching

Freeform Arduino Bliss

Designer Kimio Kosaka soldered together an entire Arduino using the difficult freeform method.

Read the full article on MAKE