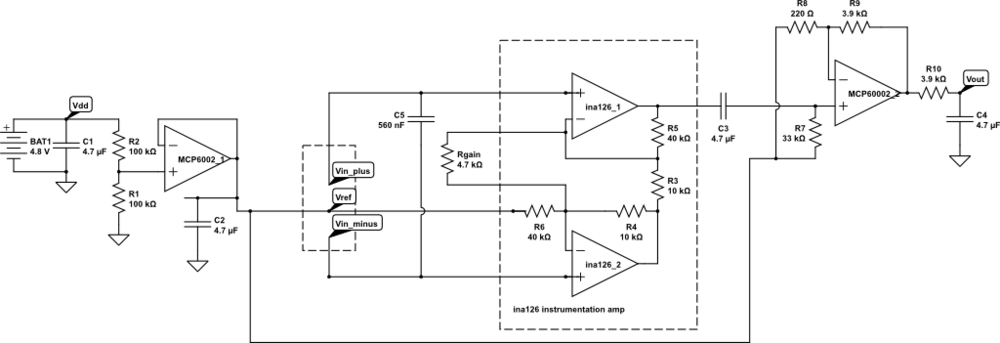
I decided that it was time to try a new circuits lab today. Although I have the INA-126 instrumentation amplifier working (with a 220Ω gain resistor for a gain of about 370), and I did get some EKG stick-on electrodes, I don’t feel like trying to debug the EKG lab today. I could do a little more with the instrumentation amplifier and the new function generator, adding the function generator output to the microphone output to see try to separate the differential gain from the common-mode gain, but I’m getting a bit tired of op-amp and instrumentation amp circuits. I’ll try to come back to them later.
Other sensor ideas from What sensors for circuits class? that I have the parts for now include phototransistors, LEDs and IR emitters, and reflectance light sensors, but I don’t feel like playing with phototransistors today either. That leaves one rather do-it-yourself sensor: a capacitance touch switch. I was thinking of implementing this with LM555 timer chip as an oscillator, detecting capacitance increase as a change in the frequency of the oscillator.
Design questions include
- What capacitance do we add by touching something?
- What frequency should the oscillator run at without the touch?
- What % change in frequency can we detect reliably? How will we do that detection?
Capacitance
Let’s do a first-principles calculation of capacitance of a touch, using a simple parallel-plate model. Let’s say that the area of the touch, pressing lightly with a finger, is about 1cm^2. We need to know the dielectric constant of the insulator and its thickness. Let’s say we use a cheap plastic wrap from the grocery store. According to Wikipedia, common plastic wraps are about 0.5 mils (12.5 µm) thick and are now generally a low-density polyethylene (LDPE). According to Bert Hickman (referring to sites that no longer exist), the relative dielectric constant for LDPE is 2.2, with a breakdown voltage of 3000v/mil (or 1500v for 0.5mil). Of course, he also claims that the common wrap material is a mix of PVC and PVDC, which seems to be out of date information. The A to Z of Materials site for LDPE claims
| Dielectric Strength (MV/m) |
27 |
| Dissipation Factor 1kHz |
0.0003 |
| Dielectric Constant 1kHz |
2.3 |
That dielectric strength would be 337V at 12.5µm, which seems more reasonable than Bert Hickman’s numbers.
I also have 3M contractor’s plastic for masking large areas when painting. It claims to be 8.9 µm thick, but I can’t figure out what the material is (they just say “high density plastic”). If it is HDPE (a possibility), the A to Z of Materials site for HDPE claims
| Dielectric Strength (MV/m) |
22 |
| Dissipation Factor 1kHz |
0.0005 |
| Dielectric Constant 1kHz |
2.3 |
which gives the same dielectric constant as LDPE, but the breakdown voltage would be about 195V at 8.9µm—still plenty for a touch sensor.
If I have 1 cm^2 (1E-4 m^2) area, 5 mil thickness (12.5E-6m), relative dielectric constant of 2.3, and ε0=8.8542E-12 F/m, I get a capacitance of 163pF for the touch.
Frequency
The LM555 can be set up as an astable oscillator:
The data sheet gives the period of the oscillator as  and the frequency as
  . If I want a slow oscillator, I’ll need to use a large resistance. The largest resistance they show in the data sheet is RA+2RB=10MΩ, and I happen to have some 3.3MΩ resistors, so 9.9MΩ seems reasonable. If I had no stray capacitance, 163pF and 9.9MΩ would give a period of 1.6msec (620Hz). But, of course there will be substantial stray capacitance—probably much larger than the touch capacitance. In any event, the increment to the period of the oscillator by adding the touch capacitance should be about 1.6msec, so we need to be able to detect that small a change in the period. The percentage change will depend mainly on the stray capacitance.
One thing that is not clear from the LM555 data sheet is what value should be used for C2. I suspect that it is just a bypass capacitor to reduce noise in the reference voltages used for the threshold, so a 4.7µF ceramic capacitor (of which I have several) should do fine. Design notes I’ve seen on the web suggest that 0.1µF is plenty, though a bypass on the Vcc input of that amount is also recommended.
Experiment
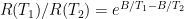
I set up the circuit on the breadboard, with RA=RB=3.3MΩ, C1 being just the stray capacitance in the circuit, and C2 being a 4.7µF ceramic bypass capacitor. I also put a 4.7µF bypass capacitor between pins 1 and 8, as well as a 470µF electrolytic capacitor, to make sure that the power supply was clean.
The resulting oscillator has a period of about 0.2msec (4.4kHz), but it fluctuated a lot, so that I could not get a clean trace on my oscilloscope. Touching the insulted sensor pad (made from Al foil and Glad Cling Wrap) caused the period to increase enormously, but to a pulse train of 3 pulses that repeated at 60Hz. I believe that what I was mainly doing was coupling in a 60Hz noise signal, rather than detecting a change in the capacitance to ground.
I could decrease the sensitivity of the circuit to noise by reducing the resistances and adding some more capacitance to C1. Adding 1nF cleans up the signal, but doesn’t eliminate the problem. I get 107±1Hz without a touch, and 60Hz with a touch. I’m still mainly coupling in 60Hz noise! I’d have to reduce the impedance to reduce the 60Hz coupling, reducing RA and RB.
Leaving in the 1nF capacitor and reducing RA and RB to 100kΩ results in a non-touch frequency of 4.05kHz and a touch frequency of 3.6kHz. This is about a 30µsec difference in period, consistent with an 150pF change in capacitance. But this frequency change seems to be almost independent of the area of contact, which is not consistent with a parallel plate model. The lower frequency still seems to be modulated by a 60Hz hum.
Removing the 1nF capacitor, but leaving the 100kΩ resistors, I get a no-touch frequency of 140kHz–156kHz (depending on how close my arm comes to the sensor) and a touch frequency around 45kHz–50kHz, a 15µsec difference in the period. A firm press with all my fingers depresses the frequency further, down to about 20kHz. Touching my laptop (reducing my resistance to ground) decreases the frequency further—pressing with my palm and touching the laptop gets the frequency own to about 13kHz.

Here is the complete layout for the capacitive touch sensor, showing (clockwise) the aluminum foil wrapped in Glad Cling Wrap (except for the folded over part where the alligator clip is attached, the breadboard with the LM555 chip, and the Arduino board.
I wouldn’t want to use the interrupt-driven timer code to measure this frequency, but a simple busy-wait loop that times the period could work, or I could add a counter to divide the frequency down (and average out many clock cycles). But this is supposed to be a circuits class, not a digital design class, so adding a counter is probably not appropriate for the lab. Perhaps a better approach is to measure the duration of the low part of the pulse, which should be about 1/3 of the total period, using the Arduino pulseIn function. Looking on the scope, the low part of the pulse seems to be closer on 1/6th of the total period than to 1/3 at the high frequency, though the ratios are more reasonable at the low frequency. I suspect that there are stray capacitance within the LM555 that account for some of the pulse shape error.
By averaging over 500 pulses, I see a switch from 1.15±0.03 µsec for the low pulse in the no-touch configuration to 5.4±0.3µsec for a firm touch and 2.8±0.2µsec for a light touch (and up to 220µsec for a full-palm touch while touching my laptop). Single pulse measurements may be a bit unreliable at those speeds, since pulseIn only has 1µsec resolution, but adding 500 pulses doesn’t take much time, unless the capacitance is very high. Putting the 1nF capacitor back in the circuit makes the low time look more like 1/3 of the period. The pulse widths are about 78.4±0.05µsec for no-touch and 80µsec–85µsec for a touch. Those are long enough to be reliably detected with even a single pulseIn call, but the difference is rather small, so setting a fixed threshold would be a bit risky.
An alternative approach to averaging 100s of pulse widths is to collect pulses until the total pulse width exceeds 200µsec and report the number of pulses collected. That mechanism results in an easily detected change in counts (from over 150 to under 60) and a response time of about 2–5msec (most of which is probably in the serial communication). A detection threshold would have to be set for each different sensor plate the circuit is connected to, but that is pretty straightforward.
Here is the code I used for detecting sensor touches with summed pulse widths (click to expand):
// Capacitive sensor timer
// Sun Jul  8 17:59:49 PDT 2012 Kevin Karplus
//
// License: CC-BY-NC http://creativecommons.org/licenses/by-nc/3.0/
//
// To use, connect the output of the LM555 oscillator to
// digital pin 2 on the Arduino.
// On initialization, the Arduino will print "Arduino ready." to serial.
// The Arduino measures the number and width of LOW pulses on pin 2 until
//    the sum of the pulse width exceeds TOTAL_PULSE_TIME.
// It then reports 3 numbers to the serial line:
// The first is the time since the start, in microseconds.
// The second is the number of pulses measured.
// The third is the average duration of the pulses.
// Serial baudrate is 115200.
// The start time may be reset by sending the character 'R'.

#define TOTAL_PULSE_TIME (200)	// total of pulse widths (in  microseconds) before reporting

unsigned long first_time;   // what was the time for the first tick since reset?
// All times are in microseconds.

// do_reset() empties the queue and sents the count to 0
void do_reset(void)
{
    noInterrupts();     // don't take interrupts in the middle of resetting
    first_time=micros();
    // let the user know that the Arduino is ready
    Serial.print(F("\nArduino ready.\n"));
    interrupts();
}

// interrupt handler for data becoming available on the serial input
// Reset if an R is received
void serialEvent(void)
{
    if (Serial.read() == 'R')
    {
        do_reset();
    }
}

void setup(void)
{
    Serial.begin(115200);       // use the fastest serial connection available
    do_reset();
    pinMode(2,INPUT);
}

void loop(void)
{   // keep trying to print out what is in the queue.
    uint32_t pulse_sum=0;
    uint16_t num_pulses=0;
    while (pulse_sum<TOTAL_PULSE_TIME)
    {    pulse_sum += pulseIn(2,LOW);
        num_pulses++;
    }
    uint32_t datum=micros();
    Serial.print(datum - first_time); // time since start (usec)
    Serial.print("\t");
    Serial.print(num_pulses); // number of pulses
    Serial.print("\t");
    Serial.println(pulse_sum*(1.0/num_pulses), 2); // avg pulse duration
}
Filed under:
Circuits course Tagged:
Arduino,
bioengineering,
capacitive touch sensor,
circuits,
course design,
LM555,
sensors,
teaching 


 .
. and Vminus is higher than that, but dropping.
 and Vminus is lower than that, but rising.
 , we can simplify further and say that Vminus swings between two threshold voltages:
  and
and  .
. , where
  , so it takes
 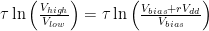 to discharge to the other threshold.
 , and so it takes
  . That is,
  .
. , which in turn requires
  . Raising Vbias makes the low part of the output waveform shorter and the high part longer. Conversely, lowering Vbias makes the low part longer and the high part shorter.
 . If we set Vbias to Vdd/2, then we can simplify further to
  .
. . If we fix
  as low as we’re willing to make it, then should we make Vbias low or r high? The number we are trying to maximize is the discharge time
  , with the constraint that
  . At equality, we have to maximize
  , which is achieved by making r as large as possible. Of course, that would mean raising Vbias, which would run us into trouble with noise at the other threshold. In general, it seems like the symmetric waveform with Vbias=Vdd/2 gives us the best noise margins.


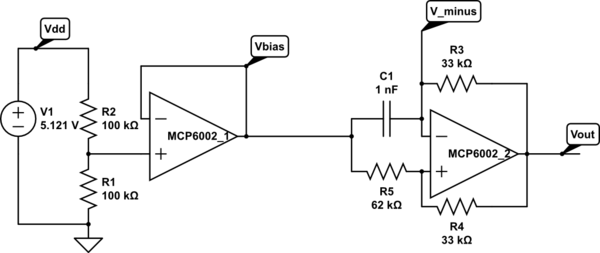
 , where the time constant τ=R3 C1. For the values of R4 and R5 here, the charge time should be 1.560 τ, and the period 3.119 τ. With the given values of R3 and C1, this should be a period of 102.9 µsec, or a frequency of 9.7 kHz. I’m measuring 8.1 kHz, not 9.7 kHz, but I think that the discrepancy is due to the slew rate limitations (which add about 12 µsec to the period) and possibly stray capacitance. With C1=47 nF, the frequency is 203.6 Hz, when the calculation says it should be 206.7 Hz, well within the accuracy of the components.


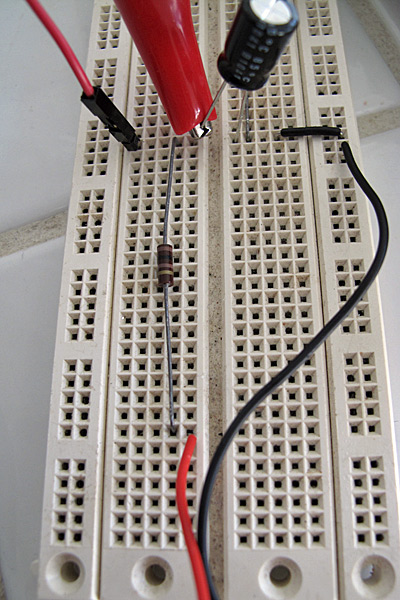
 curve. The report the B-value as a 2-point fit for T=25° C and T=85° C, but they also report resistance values every 5° C from –40° C to 105° C. One can compute the B-value for any pair:


 curve rather than mine? At R=6685Ω, we get the same temperature either way (96.446° F). At the resistance they claim for 0° C (27348Ω), their B-value model would give 33.90° F and mine would give 29.37° F. At the resistance I measured for 0° C (25.5kΩ), their model would give 36.67° F, while mine gives 32.32° F (which is closer than the measurement error I had on temperatures). So it looks like relying blindly on their B-value model introduces an error of over 4° F at low temperature, but in a digital thermometer for human body temperature, one would get nearly the same result with either calibration.
 , where we are approximating
  for temperature T in Kelvin. We’d like the voltage to be as linear as possible, which means we want the second derivative of Vout with respect to T to be zero. Obviously, we can’t do that for all values of T, but we might be able to do it for a particular value of T, and to have a small second derivative in that neighborhood.

 , that is if
  .
.


 , where
  is the resistance one would get for putting the series and parallel resistors in parallel. This is exactly the same condition as before, but with
  .
. and a series resistor consisting of R1 and R2 in parallel:
  . The only reason to put in a parallel resistor would be to restrict the voltage range (which might be useful if the output were to be amplified, but is not useful if the output is going directly into an analog-to-digital converter whose full-scale range is 0 to Vdd).


 to the data, where R is the resistance in Ω and T is the temperature in degrees Kelvin. But gnuplot got as good a fit using just A and B as using the third order fit, with
  providing an excellent fit.

 , which is the equation most often used in thermistor specs, I get A=0.24Ω and B=3157°K, which is not that close to the spec (10kΩ @ 25°C, B=3435±35°K, so A=0.0992Ω). Note that the spec curve fits the data quite well for warm temperatures, but deviates badly for cold ones.


