Posts with «code» label

MIT's light-up robot garden teaches you how to code

If you're teaching kids how to code, what do you do to show that software makes an impact in the real world? MIT has a clever idea: a robot garden. The project lets you control a grid of Arduino-linked "plants" through programming that makes them blossom and light up in pretty (and occasionally mesmerizing) ways. It'll even teach the virtues of distributed computing -- you can tell these leafy robots to bloom or change color in algorithm-driven sequences. The garden is just a demo for now, but it'll eventually turn into an easy-to-replicate curriculum for students who'd otherwise have to settle for seeing their results on-screen.

[Image credit: Jason Dorfman, CSAIL]

Filed under: Science, Software

Comments

Source: MIT News

433 MHz RF module with Arduino Tutorial 2


There are 4 parts to this tutorial:
To get the most out of this tutorial - it is best to start at tutorial Part 1, and then progress to Part 2 then Part 3 and then do Part 4 last. Doing the RF tutorials in this order will help you to understand the process better.


Project 2: RF Remote Copy

In the previous project, we transmitted a signal wirelessly from one Arduino to another. It was there to help troubleshoot communication between the modules. It was important to start with a very short distance (1-2 cm) and then move the RF modules further apart to test the range. The range can be extended by soldering an antenna to the module, or by experimenting with different voltage supplies to the modules (making sure to keep within the voltage limits of the modules.)
In this project - we aim to receive a signal from an RF remote. The remote that I am using is a Mercator Remote Controller for a Fan/Light. (Remote controller code is FRM94). It is important that you use a remote that transmits at the same frequency as your receiver. In this case, my remote just happens to use a frequency of 433MHz. I was able to receive RF signals from from a distance of about 30cm without an antenna (from my remote to the receiver).


Video


Here are the parts that you will need to carry out this project:
 

Parts Required


Remote Controller


You can quickly test your remote, by pressing one of the buttons in close proximity to the RF receiver (using the same sketch as in Project 1), and you should see the LED flicker on an off in response to the button press. If you don't see the LED flickering, then this project will not work for you.

Here is a picture of the remote controller that I am using:


Arduino Sketch - Remote Receiver

The following sketch will make the Arduino wait until a signal is detected from the remote (or other 433 MHz RF device). Once triggered, it will turn the LED ON, and start to collect and store the signal data into an array.
I did my best to keep the signal reading section of the sketch free from other functions or interruptions.The aim is to get the Arduino to focus on reading ONLY... and once the reading phase is complete, it will report the signal data to the Serial monitor. So you will need to have the Serial monitor open when you press the remote control button.
The remote control signal will be made up of HIGH and LOW signals - which I will try to illustrate later in the tutorial. But for now, all you need to know is that the Signal will alternate between HIGH and LOW signals, and that they can be different lengths.
This sketch aims to identify how long each LOW and HIGH signal is (to make up the complete RF remote signal). I have chosen to capture 500 data points(or 250 LOW/HIGH combinations).You may wish to increase or decrease the dataSize variable to accomodate your specific RF signal. In my case, I only really needed 300 data points, because there was a "flat" signal for the last 200 data points (characterised by 200 repetitions of a LOW signal length of 0 and HIGH signal length of 255)

--------------------------------------------------


Receiver Fritzing Sketch


Results

After pressing the button on the RF remote, the data signal is printed to the Serial Monitor. You can copy the data to a spreadsheet program for review. This is an example of the signal produced after pushing the button on the remote for turning the fan/light on.
The following code was produced from pushing the button responsible for turning the light off:
The code sequence above may seem a bit random until you start graphing it. I grabbed the LOW column - and produced the following chart:
The chart above is a bit messy - mainly because the timing is slightly out... in that sometimes it can squeeze an extra read from a particular signal. But what is important to note here is that you can differentiate a LONG signal from a SHORT signal. I have drawn a couple of red dotted lines where I believe most of the readings tend to sit. I then used a formula in the spreadsheet to calibrate the readings and make them a bit more uniform. For example, if the length of the signal was greater than 4 analogReads, then I converted this to 6. If it was less than 4 analogReads, then I converted it to 2. I used a frequency table to help decide on the cutoff value of 4, and just decided to pick the two values (2 for short, and 6 for long) based on the frequency tables below. I could have chosen 5 as the LONG value, but there were more 6's overall.

  **The meaning of "frequency" in the following tables relate to the "number of times" a specific signal length is recorded.


And this is the resulting chart:

You will notice that the pattern is quite repetitive. I helped to identify the sections with vertical red lines (near the bottom of the chart). In other words, the signal produced by the remote is repeated 6 times.
I then did the same for the HIGH signal column and combined the two to create the following chart:


You will notice that the HIGH signals also have a repetitive pattern, however have a Very long length at the end of each section. This is almost a break to separate each section.
This is what a single section looks like zoomed in:


SL = [Short LOW] signal. - or short blue bar
SH = [Short HIGH] signal - or short yellow bar
LL = [Long LOW] signal - or long blue bar
LH = [Long HIGH] signal - or long yellow bar
VLH = [Very long HIGH} signal - or very long yellow bar (~92 analogReads in length)


  You will notice that there are only about 6 different combinations of the signals mentioned above. We can use this to create a coding system as described below:


We can use this coding system to describe the signals. The charts below show the difference between turning the LIGHT ON and LIGHT OFF.


PLEASE NOTE: You may notice when you copy the signals from the Serial monitor that you get a series of (0,255) combinations. This is actually a timeout sequence - which generally occurs after the signal is complete.

 Here is an example of what I mean.


This is the end of tutorial 2. In the next tutorial, we will use the code acquired from the remote to turn the FAN LIGHT on and off (using the 433 MHz RF transmitter).

Click here for Tutorial 3

ScottC 26 Jun 18:05

433 MHz RF module with Arduino Tutorial 2

Project 2: RF Remote Copy

In the previous project, we transmitted a signal wirelessly from one Arduino to another. It was there to help troubleshoot communication between the modules. It was important to start with a very short distance (1-2 cm) and then move the RF modules further apart to test the range. The range can be extended by soldering an antenna to the module, or by experimenting with different voltage supplies to the modules (making sure to keep within the voltage limits of the modules.)

In this project - we aim to receive a signal from an RF remote. The remote that I am using is a Mercator Remote Controller for a Fan/Light. (Remote controller code is FRM94). It is important that you use a remote that transmits at the same frequency as your receiver. In this case, my remote just happens to use a frequency of 433MHz. I was able to receive RF signals from from a distance of about 30cm without an antenna (from my remote to the receiver).


Video


Here are the parts that you will need to carry out this project:
 

Parts Required


Remote Controller

You can quickly test your remote, by pressing one of the buttons in close proximity to the RF receiver (using the same sketch as in Project 1), and you should see the LED flicker on an off in response to the button press. If you don't see the LED flickering, then this project will not work for you.

Here is a picture of the remote controller that I am using:


Arduino Sketch - Remote Receiver

The following sketch will make the Arduino wait until a signal is detected from the remote (or other 433 MHz RF device). Once triggered, it will turn the LED ON, and start to collect and store the signal data into an array.

I did my best to keep the signal reading section of the sketch free from other functions or interruptions.The aim is to get the Arduino to focus on reading ONLY... and once the reading phase is complete, it will report the signal data to the Serial monitor. So you will need to have the Serial monitor open when you press the remote control button.

The remote control signal will be made up of HIGH and LOW signals - which I will try to illustrate later in the tutorial. But for now, all you need to know is that the Signal will alternate between HIGH and LOW signals, and that they can be different lengths.

This sketch aims to identify how long each LOW and HIGH signal is (to make up the complete RF remote signal). I have chosen to capture 500 data points(or 250 LOW/HIGH combinations).You may wish to increase or decrease the dataSize variable to accomodate your specific RF signal. In my case, I only really needed 300 data points, because there was a "flat" signal for the last 200 data points (characterised by 200 repetitions of a LOW signal length of 0 and HIGH signal length of 255)


--------------------------------------------------
 1
2
3
4
5
6
7
8
9
10
11
12
13
14
15
16
17
18
19
20
21
22
23
24
25
26
27
28
29
30
31
32
33
34
35
36
37
38
39
40
41
42
43
44
45
46
47
48
49
50
51
52
53
54
55
56
57
58
59
60
61
62
63
64
65
66
67
68
69
70
71
72
73
74
75
76
77
78
79
80
81
82
83
84
85
86
87


/* 
  RF Remote Capture sketch 
     Written by ScottC 24 Jun 2014
     Arduino IDE version 1.0.5
     Website: http://arduinobasics.blogspot.com
     Receiver: XY-MK-5V
     Description: Use Arduino to Receive RF Remote signal          
 ------------------------------------------------------------- */

 const int dataSize = 500; //Arduino memory is limited (max=1700)
 byte storedData[dataSize]; //Create an array to store the data
 #define ledPin 13           //Onboard LED = digital pin 13
 #define rfReceivePin A0     //RF Receiver data pin = Analog pin 0
 const unsigned int upperThreshold = 100; //upper threshold value
 const unsigned int lowerThreshold = 80; //lower threshold value
 int maxSignalLength = 255; //Set the maximum length of the signal
 int dataCounter = 0; //Variable to measure the length of the signal
 unsigned long startTime=0; //Variable to record the start time
 unsigned long endTime=0; //Variable to record the end time
 unsigned long signalDuration=0; //Variable to record signal reading time
 

 void setup(){
  Serial.begin(9600);
  pinMode(ledPin, OUTPUT);
  
  /* The following code will only run ONCE --------------
  ---Press the reset button on the Arduino to run again-- */
  
  while(analogRead(rfReceivePin)<1){
      //Wait here until a LOW signal is received
      startTime=micros(); //Update start time with every cycle.
  }
  digitalWrite(ledPin, HIGH); //Turn LED ON
  
  
  //Read and store the rest of the signal into the storedData array
  for(int i=0; i<dataSize; i=i+2){
    
    //Identify the length of the LOW signal---------------LOW
    dataCounter=0; //reset the counter
    while(analogRead(rfReceivePin)>upperThreshold && dataCounter<maxSignalLength){
      dataCounter++;
    }
    storedData[i]=dataCounter;
    
    //Identify the length of the HIGH signal---------------HIGH
    dataCounter=0;//reset the counter
    while(analogRead(rfReceivePin)<lowerThreshold && dataCounter<maxSignalLength){
      dataCounter++;
    }
    storedData[i+1]=dataCounter;
    
    //Any readings between the two threshold values will be ignored.
    //The LOW or HIGH signal length must be less than the variable "maxSignalLength"
    //otherwise it will be truncated. All of the HIGH signals and LOW signals combined
    //must not exceed the variable "dataSize", otherwise it will be truncated.
    //The maximum number of signals is 1700 - if you try to extend this variable to a higher
    //number than 1700 - then the Arduino will freeze up and sketch will not work.
    //-------------------------------------------------------------
  }
  
  endTime=micros(); //Record the end time of the read period.
  signalDuration = endTime-startTime;
  
  digitalWrite(ledPin, LOW);//Turn LED OFF
  
  //Send report to the Serial Monitor
  Serial.println("=====================");
  Serial.print("Read duration: ");
  Serial.print(signalDuration);
  Serial.println(" microseconds");
  Serial.println("=====================");
  Serial.println("LOW,HIGH");
  delay(20);
  for(int i=0; i<dataSize; i=i+2){
    Serial.print(storedData[i]);
    Serial.print(",");
    Serial.println(storedData[i+1]);
    delay(20);
  }
 }

 void loop(){
   //Do nothing here
 }


Receiver Fritzing Sketch

Results

After pressing the button on the RF remote, the data signal is printed to the Serial Monitor. You can copy the data to a spreadsheet program for review. This is an example of the signal produced after pushing the button on the remote for turning the fan/light on.
The following code was produced from pushing the button responsible for turning the light off:
The code sequence above may seem a bit random until you start graphing it. I grabbed the LOW column - and produced the following chart:
 
The chart above is a bit messy - mainly because the timing is slightly out... in that sometimes it can squeeze an extra read from a particular signal. But what is important to note here is that you can differentiate a LONG signal from a SHORT signal. I have drawn a couple of red dotted lines where I believe most of the readings tend to sit. I then used a formula in the spreadsheet to calibrate the readings and make them a bit more uniform. For example, if the length of the signal was greater than 4 analogReads, then I converted this to 6. If it was less than 4 analogReads, then I converted it to 2. I used a frequency table to help decide on the cutoff value of 4, and just decided to pick the two values (2 for short, and 6 for long) based on the frequency tables below. I could have chosen 5 as the LONG value, but there were more 6's overall.
 
  **The meaning of "frequency" in the following tables relate to the "number of times" a specific signal length is recorded.

 
And this is the resulting chart:

You will notice that the pattern is quite repetitive. I helped to identify the sections with vertical red lines (near the bottom of the chart). In other words, the signal produced by the remote is repeated 6 times.
I then did the same for the HIGH signal column and combined the two to create the following chart:


You will notice that the HIGH signals also have a repetitive pattern, however have a Very long length at the end of each section. This is almost a break to separate each section.
This is what a single section looks like zoomed in:


SL = [Short LOW] signal. - or short blue bar
SH = [Short HIGH] signal - or short yellow bar
LL = [Long LOW] signal - or long blue bar
LH = [Long HIGH] signal - or long yellow bar
VLH = [Very long HIGH} signal - or very long yellow bar (~92 analogReads in length)

 
  You will notice that there are only about 6 different combinations of the signals mentioned above. We can use this to create a coding system as described below:


We can use this coding system to describe the signals. The charts below show the difference between turning the LIGHT ON and LIGHT OFF.


PLEASE NOTE: You may notice when you copy the signals from the Serial monitor that you get a series of (0,255) combinations. This is actually a timeout sequence - which generally occurs after the signal is complete.
 
 Here is an example of what I mean.


This is the end of tutorial 2. In the next tutorial, we will use the code acquired from the remote to turn the FAN LIGHT on and off (using the 433 MHz RF transmitter).

Click here for Tutorial 3

ScottC 26 Jun 18:05

Basics of ARDUINO BOARD...

The video explains some basics of ARDUINO BOARD and its related components...

beginer in electronics needs to program

hi, im a twelve year old boy who is not an expert  AT ALL, but knows the basics

i've made bristlebots, speaker tones, dc motor cars  and other stuff

BUT

when i have to program  in arduino UNO i just copy other codes from other people

cause...  I dont know how to program at all!!!! i think arduino's language is c,and i don't know  how to program


anybody knows how to program arduino

and can give me a little tutorial about key words and etcetera like setup, delay, control of dc motors sensor etc...

read more

Trying to use a light sensor to control a stepper motor

Am trying to control a stepper motor with a light sensor, when high do this and when low do that. But it dn't seem to be working please help.

read more

How to contol servo speed from serial

Hello all

I have  renbotics ServoShield and I have made a code on arduino where from serialport I can send commads to servos and it happens with that way... S01P1200,S14P2300etc..I mean that  Servo 1 to 1200 posion and servo 14 to 2300 posion

read more

How to contol servo speed from serial

Hello all

I have  renbotics ServoShield and I have made a code on arduino where from serialport I can send commads to servos and it happens with that way... S01P1200,S14P2300etc..I mean that  Servo 1 to 1200 posion and servo 14 to 2300 posion

read more

HC-SR04 Ultrasonic Sensor


Introduction:

The HC-SR04 Ultrasonic Sensor is a very affordable proximity/distance sensor that has been used mainly for object avoidance in various robotics projects . It essentially gives your Arduino eyes / spacial awareness and can prevent your robot from crashing or falling off a table. It has also been used in turret applications, water level sensing, and even as a parking sensor. This simple project will use the HC-SR04 sensor with an Arduino and a Processing sketch to provide a neat little interactive display on your computer screen.


Parts Required:
Freetronics Eleven or any compatible Arduino.
HC-SR04 Ultrasonic Sensor
Mini Breadboard 4.5cm x 3.5cm
Protoshieldand female header pins (not essential - but makes it more tidy)
Wiresto connect it all together


The Video:


The Arduino Sketch:


     The above sketch was created using Fritzing.


Arduino Code:
You can download the Arduino IDE from this site.

 1
2
3
4
5
6
7
8
9
10
11
12
13
14
15
16
17
18
19
20
21
22
23
24
25
26
27
28
29
30
31
32
33
34
35
36
37
38
39
40
41
42
43
44
45
46
47
48
49
50
51
52
53
54
55
56
57
58
59
60
/*
HC-SR04 Ping distance sensor:
VCC to arduino 5v
GND to arduino GND
Echo to Arduino pin 7
Trig to Arduino pin 8

This sketch originates from Virtualmix: http://goo.gl/kJ8Gl
Has been modified by Winkle ink here: http://winkleink.blogspot.com.au/2012/05/arduino-hc-sr04-ultrasonic-distance.html
And modified further by ScottC here: http://arduinobasics.blogspot.com.au/2012/11/arduinobasics-hc-sr04-ultrasonic-sensor.html
on 10 Nov 2012.
*/


#define echoPin 7 // Echo Pin
#define trigPin 8 // Trigger Pin
#define LEDPin 13 // Onboard LED

int maximumRange = 200; // Maximum range needed
int minimumRange = 0; // Minimum range needed
long duration, distance; // Duration used to calculate distance

void setup() {
Serial.begin (9600);
pinMode(trigPin, OUTPUT);
pinMode(echoPin, INPUT);
pinMode(LEDPin, OUTPUT); // Use LED indicator (if required)
}

void loop() {
/* The following trigPin/echoPin cycle is used to determine the
distance of the nearest object by bouncing soundwaves off of it. */
digitalWrite(trigPin, LOW);
delayMicroseconds(2);

digitalWrite(trigPin, HIGH);
delayMicroseconds(10);

digitalWrite(trigPin, LOW);
duration = pulseIn(echoPin, HIGH);

//Calculate the distance (in cm) based on the speed of sound.
distance = duration/58.2;

if (distance >= maximumRange || distance <= minimumRange){
/* Send a negative number to computer and Turn LED ON
to indicate "out of range" */
Serial.println("-1");
digitalWrite(LEDPin, HIGH);
}
else {
/* Send the distance to the computer using Serial protocol, and
turn LED OFF to indicate successful reading. */
Serial.println(distance);
digitalWrite(LEDPin, LOW);
}

//Delay 50ms before next reading.
delay(50);
}

The code above was formatted using hilite.me


Processing Code:
You can download the Processing IDE from this site.

 1
2
3
4
5
6
7
8
9
10
11
12
13
14
15
16
17
18
19
20
21
22
23
24
25
26
27
28
29
30
31
32
33
34
35
36
37
38
39
40
41
42
43
44
45
46
47
48
49
50
51
52
53
54
55
56
57
58
59
60
61
62
63
64
65
66
67
68
69
70
71
72
73
74
75
76
77
78
79
80
81
82
83
84
85
86
87
88
89
90
91
92
93
94
95
96
97
98
99
100
101
102
103
104
105
106
107
108
109
110
111
112
113
114
115
116
117
118
119
120
121
122
123
124
125
126
127
128
/* The following Processing Sketch was created by ScottC on
the 10 Nov 2012 : http://arduinobasics.blogspot.com/

Inspired by this Processing sketch by Daniel Shiffman:
http://processing.org/learning/basics/sinewave.html

*/
import processing.serial.*;


int numOfShapes = 60; // Number of squares to display on screen
int shapeSpeed = 2; // Speed at which the shapes move to new position
// 2 = Fastest, Larger numbers are slower

//Global Variables
Square[] mySquares = new Square[numOfShapes];
int shapeSize, distance;
String comPortString;
Serial myPort;

/* -----------------------Setup ---------------------------*/
void setup(){
size(displayWidth,displayHeight); //Use entire screen size.
smooth(); // draws all shapes with smooth edges.

/* Calculate the size of the squares and initialise the Squares array */
shapeSize = (width/numOfShapes);
for(int i = 0; i<numOfShapes; i++){
mySquares[i]=new Square(int(shapeSize*i),height-40);
}

/*Open the serial port for communication with the Arduino
Make sure the COM port is correct - I am using COM port 8 */
myPort = new Serial(this, "COM8", 9600);
myPort.bufferUntil('\n'); // Trigger a SerialEvent on new line
}

/* ------------------------Draw -----------------------------*/
void draw(){
background(0); //Make the background BLACK
delay(50); //Delay used to refresh screen
drawSquares(); //Draw the pattern of squares
}


/* ---------------------serialEvent ---------------------------*/
void serialEvent(Serial cPort){
comPortString = cPort.readStringUntil('\n');
if(comPortString != null) {
comPortString=trim(comPortString);

/* Use the distance received by the Arduino to modify the y position
of the first square (others will follow). Should match the
code settings on the Arduino. In this case 200 is the maximum
distance expected. The distance is then mapped to a value
between 1 and the height of your screen */
distance = int(map(Integer.parseInt(comPortString),1,200,1,height));
if(distance<0){
/*If computer receives a negative number (-1), then the
sensor is reporting an "out of range" error. Convert all
of these to a distance of 0. */
distance = 0;
}
}
}


/* ---------------------drawSquares ---------------------------*/
void drawSquares(){
int oldY, newY, targetY, redVal, blueVal;

/* Set the Y position of the 1st square based on
sensor value received */
mySquares[0].setY((height-shapeSize)-distance);

/* Update the position and colour of each of the squares */
for(int i = numOfShapes-1; i>0; i--){
/* Use the previous square's position as a target */
targetY=mySquares[i-1].getY();
oldY=mySquares[i].getY();

if(abs(oldY-targetY)<2){
newY=targetY; //This helps to line them up
}else{
//calculate the new position of the square
newY=oldY-((oldY-targetY)/shapeSpeed);
}
//Set the new position of the square
mySquares[i].setY(newY);

/*Calculate the colour of the square based on its
position on the screen */
blueVal = int(map(newY,0,height,0,255));
redVal = 255-blueVal;
fill(redVal,0,blueVal);

/* Draw the square on the screen */
rect(mySquares[i].getX(), mySquares[i].getY(),shapeSize,shapeSize);
}
}

/* ---------------------sketchFullScreen---------------------------*/
// This puts processing into Full Screen Mode
boolean sketchFullScreen() {
return true;
}

/* ---------------------CLASS: Square ---------------------------*/
class Square{
int xPosition, yPosition;

Square(int xPos, int yPos){
xPosition = xPos;
yPosition = yPos;
}

int getX(){
return xPosition;
}

int getY(){
return yPosition;
}

void setY(int yPos){
yPosition = yPos;
}
}

The code above was formatted using hilite.me


If you like this page, please do me a favour and show your appreciation :

  Visit my ArduinoBasics Google + page.
Follow me on Twitter by looking for ScottC @ArduinoBasics.
Have a look at my videos on my YouTube channel.


However, if you do not have a google profile...
Feel free to share this page with your friends in any way you see fit.

Speech / Voice Recognition – remix.

It’s about right time to release one more “remix” for one of my blog, published almost a year ago. I haven’t got much comments, not many as I was expecting, on a topic. There are some reasons, that would explain this phenomenon, but I would better to start outlining what I did in new release, and some of you who tried old version would be impressed by progress I’ve made!

Basic structure was left almost intact. Essential parts of the project: Filtering 2D and Cross-Correlation are the same, so please read my old post, if you come across this one w/o seen it first. What differs is “preprocessing”, before we get to the filtering stage. In first, I ported a code on Leonardo board.  The easiness of connecting electret mic to Leonardo, just didn’t give me a choice!  I played already with Leonardo ADC – electret mic’s in my previous post, and would assure you, that this guys were designed to work as a team. Uno followers have to solder a pre-amplifier, not big deal, the same time not really interesting.  Code would run on Uno, except Timer and ADC settings, which you could always “copy/paste” from the old version. Feel free, be my guest.

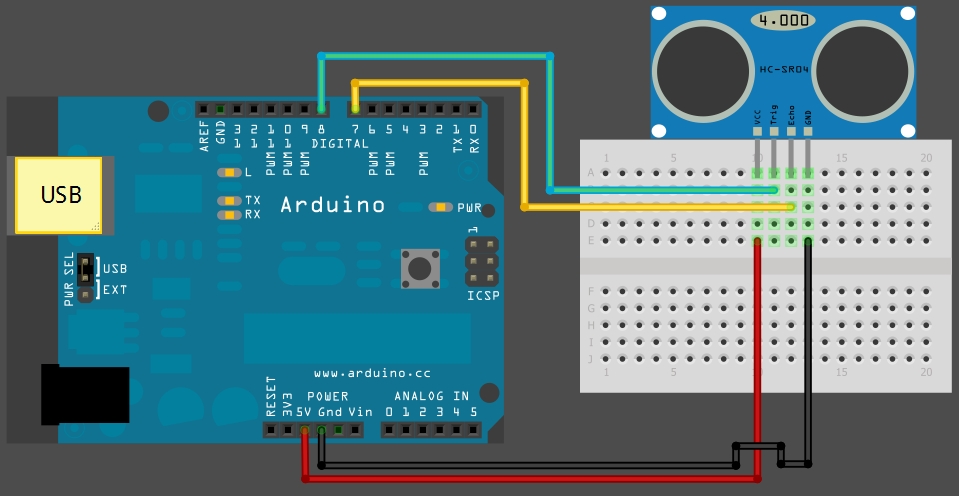
Analog front-end is absolutely the same as I used in Sound Localization project. You would need only one mic here, just reduce the number of electrical components down.

Sampling subroutine based on Timer 4, and arduino Leonardo internal PGA set to gain x40. There are a comments in the code, so you could adjust gain up or down depends on the sensitivity of mic you have.

Windowing LUT is slightly modified Hamming/Hann cosine function,  I’d say my table is an “intermediate” version of both mention inventors.

FFT is my best achievements of this year, RADIX-4.  Compare to old code, about 3x faster. This is why I was able to increase FFT_SIZE up to 128,  still having plenty of time.  Magnitude calculation is based on approximation, very fast, because no square root extraction required. Accuracy, in the worst case scenario ~95%, which is more than enough in this project.

I changed Non-Linear compression algorithm, as now there are more Bins – 64 to pack in 16 Bands. Math is simple, and hope doesn’t need an extensive comments. Packing is necessary due memory limits, 1 sec password in current configuration (16 bands with sampling rate 4 kHz) occupied 1 kByte, full size of EEPROM on Leonardo or Uno boards.

Command Line Interface is preserved. Here is the instructions, how to set everything up and running.

And here how spectrogram looks like in LibreOffice, test phrase “Front right”, (OS Linux Ubuntu, 12.04):


Instructions.

 Get your microphone wired / connected? All checked at least a couple times with multimeter, voltages looks o’k? Good, now you are ready to start! ( Don’t forget to upload a sketch to your arduino / Leonardo -);

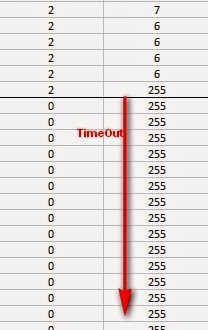
1. X. First of all, open serial monitor window, and check boadrate.
Should be 115200. Next, type “x” and Enter. Get some response? Does
it look like a table? Excellent, data you are looking at is “raw” 
sampling data. Probably, just noise, acoustical or electrical. 

2. F. Second test, type “f” - Enter. Again, arduino would print out 
a table. This time data represent “processed” by FFT analog signal. 
Each bin corresponds to frequency range 32 Hz. If you have a signal
generator , it's right time to do a detailed check up microphone, 
wiring, and software. If don't have, you can use your computer's 
sound card and some program, there are plenty of them available 
on-line free of charge. Connect generator to PC USB speackers, and
run a single tone, anything in audible range 16 – 2000 Hz. Check 
again using “f” command, if arduino registers a signal, and it's in
right bin. Due “windowing” function, even pure single tone would 
show up at least in 2-3 neighboring bins. Amplitude depends on 
sensitivity of the mic, and volume of the sound. Sending “x” you can 
confirm, that there is no “clipping” too many “– 511” or “+511”.

3. S. Next, if all goes well till this step, you probably already
notice, that whenever a mic picking-up a sound – yellow on-board LED
lights up. Now, it's better shutdown your TV, iPad, radio. 
Make your environment as quite as possible. Try to say something 
with your own voice, and see if led lighting up when you start 
talking, and than after ~1 sec it goes off. Repeat a few times, 
adjusting a volume and / or distance to the mic, so led goes “on/off”
reliable. Send “s” command when led is off. Don't worry, it should 
be no report on screen, till you say a word. Procedure is simple, 
send “s” - say something. After you talk, and get a printing, look 
carefully. Your objective, is get a “spectrogram” which consist of 
a few spots / blobs of digits, randomly distributed all over the 
“surface”. Repeat a few times with one word, than try another one 
and so on. With short words, very likely reporting data would be 
concentrated at the top ( you may need to scroll up to see the 
beginning), if this is a case, better to choose longer words or talk
in slower tempo. Just remember, there are three dimension, time, 
frequency and volume. You can use a signal generator here again, 
spectrogram should looks like a vertical line, may be 2 - 3 parallel
lines on low frequencies test tones. 
 Changing a frequency, you can even get some curves. What is 
important, the must be no negative numbers. If you see them – 
"overloading" happens, Decrease a volume. Dynamic range is limited 
by 127, more close you can get to this value w/o negatives, 
the better. And last dimension is a frequency. For man, it would 
be a little bit hard to “detach” a spectrogram from the left border.
It's true for everyone, who is not opera singer, me no exceptions.... 

4. R and G. After you practice enough, and received Manny nice 
looking spectrograms, it's time to check with arduino, if it's 
agree with you / thinks similar. Send “r” - recording, and say 
a word you've get your best spectrum with. Wait a few seconds, 
writing to EEPROM takes time. Now send a “g” and say the same word.
In the same manner, tonality and volume. See on the outputs, what 
is the cross-correlation factor you received. More than 50% - very 
good for beginning. Less – try again a few more times sending “g” and
repeating same word, maybe slightly varying pronunciation. Try to 
reach best recognition, “crack” your own password code! 
( note: Negatives number on “G” reports-form must be present.)
If no luck try another password code. Now you know the drill: 
S – repeat, repeat, repeat....., R, G – repeat, repeat, repeat..... 
(joke). Can't get good match? Try your computer's test sounds, 
beeps, horns, clicks, barks – whatever your OS has. It doesn't have
to be shorter than 1 sec, but only 1 second in the beginning 
would be stored / compared. My computer is able to repeat the same 
sound track (speakers test - "front right") with enormously high 
cross-factor 99 % ! I'm not a computer, my best short 86 % so far...

5. P. This command is simply reading the content of the EEPROM, 
so you always can verify, what you stored last time. 
Editing / formatting this data you can store a table in the arduino 
FLASH memory using PROGMEM. About 10 – 15 commands. Of course, 
storing data in external SD card or EEPROM, could greatly increase
the “vocabulary”, the same time design of fast cross-correlation 
algorithm with multiple “pattern”s would be another brain teasing
puzzle -);.

Have fun!

Link to arduino sketch, VOR (VOice Recognition).