

433 MHz RF module with Arduino Tutorial 2

Project 2: RF Remote Copy
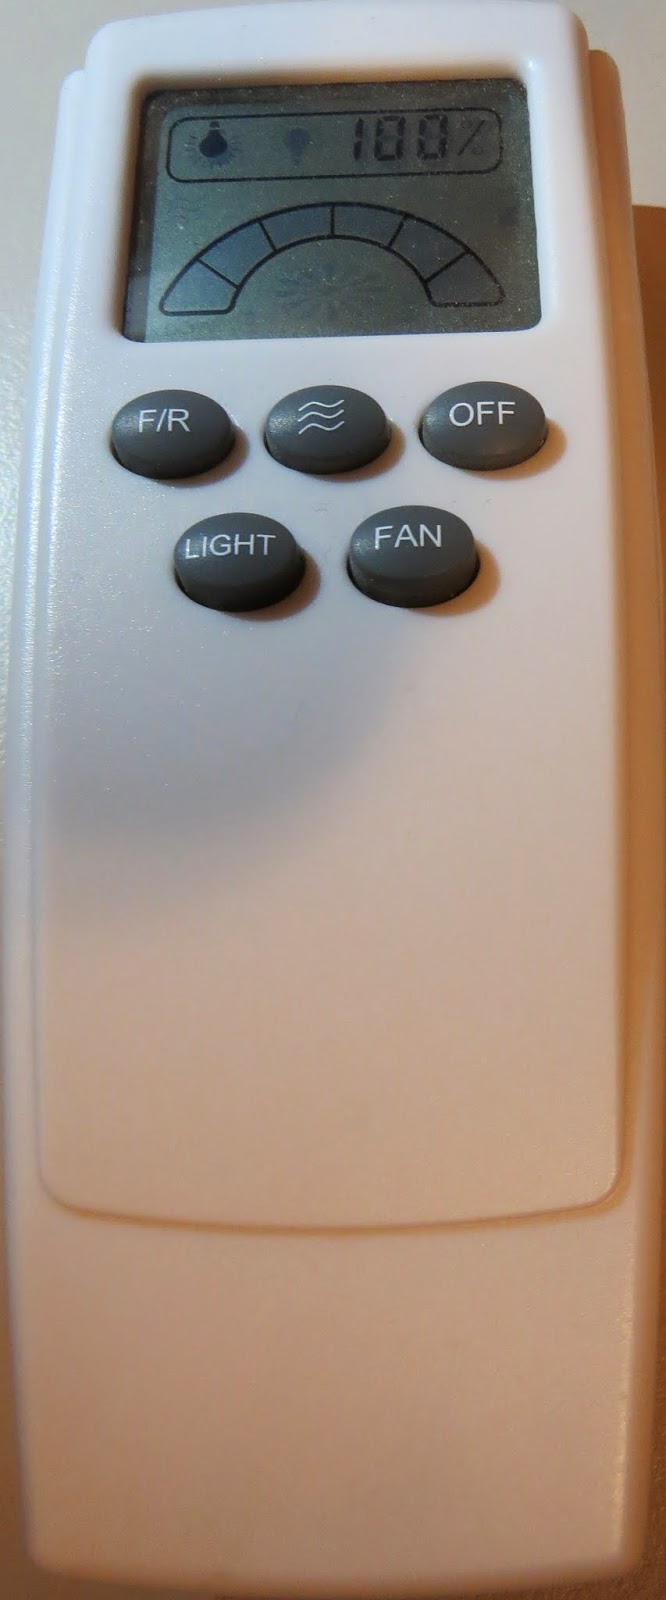
In this project - we aim to receive a signal from an RF remote. The remote that I am using is a Mercator Remote Controller for a Fan/Light. (Remote controller code is FRM94). It is important that you use a remote that transmits at the same frequency as your receiver. In this case, my remote just happens to use a frequency of 433MHz. I was able to receive RF signals from from a distance of about 30cm without an antenna (from my remote to the receiver).
Video

Here are the parts that you will need to carry out this project:
Parts Required
- 1 x Arduino UNO or compatible board
- Breadboard
- Wires
- Mercator FRM94 Remote Controller for Fan/Light (Transmitter Model: TR107A)
- RF Module (433 Mhz) - Receiver or the 315 Mhz version
Remote Controller
You can quickly test your remote, by pressing one of the buttons in close proximity to the RF receiver (using the same sketch as in Project 1), and you should see the LED flicker on an off in response to the button press. If you don't see the LED flickering, then this project will not work for you.
Here is a picture of the remote controller that I am using:
 |  |
Arduino Sketch - Remote Receiver
The following sketch will make the Arduino wait until a signal is detected from the remote (or other 433 MHz RF device). Once triggered, it will turn the LED ON, and start to collect and store the signal data into an array.
I did my best to keep the signal reading section of the sketch free from other functions or interruptions.The aim is to get the Arduino to focus on reading ONLY... and once the reading phase is complete, it will report the signal data to the Serial monitor. So you will need to have the Serial monitor open when you press the remote control button.
The remote control signal will be made up of HIGH and LOW signals - which I will try to illustrate later in the tutorial. But for now, all you need to know is that the Signal will alternate between HIGH and LOW signals, and that they can be different lengths.
This sketch aims to identify how long each LOW and HIGH signal is (to make up the complete RF remote signal). I have chosen to capture 500 data points(or 250 LOW/HIGH combinations).You may wish to increase or decrease the dataSize variable to accomodate your specific RF signal. In my case, I only really needed 300 data points, because there was a "flat" signal for the last 200 data points (characterised by 200 repetitions of a LOW signal length of 0 and HIGH signal length of 255)
--------------------------------------------------
1 |
|
Receiver Fritzing Sketch
 |  |
 | |
 |
Results
After pressing the button on the RF remote, the data signal is printed to the Serial Monitor. You can copy the data to a spreadsheet program for review. This is an example of the signal produced after pushing the button on the remote for turning the fan/light on.  | |
| The following code was produced from pushing the button responsible for turning the light off: | |
 | |
| The code sequence above may seem a bit random until you start graphing it. I grabbed the LOW column - and produced the following chart: | |
 | |
| The chart above is a bit messy - mainly because the timing is slightly out... in that sometimes it can squeeze an extra read from a particular signal. But what is important to note here is that you can differentiate a LONG signal from a SHORT signal. I have drawn a couple of red dotted lines where I believe most of the readings tend to sit. I then used a formula in the spreadsheet to calibrate the readings and make them a bit more uniform. For example, if the length of the signal was greater than 4 analogReads, then I converted this to 6. If it was less than 4 analogReads, then I converted it to 2. I used a frequency table to help decide on the cutoff value of 4, and just decided to pick the two values (2 for short, and 6 for long) based on the frequency tables below. I could have chosen 5 as the LONG value, but there were more 6's overall. **The meaning of "frequency" in the following tables relate to the "number of times" a specific signal length is recorded. | |
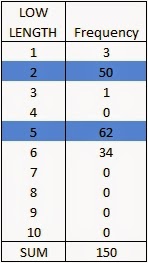 |  |
And this is the resulting chart: | |
 | |
You will notice that the pattern is quite repetitive. I helped to identify the sections with vertical red lines (near the bottom of the chart). In other words, the signal produced by the remote is repeated 6 times. I then did the same for the HIGH signal column and combined the two to create the following chart: | |
 | |
| You will notice that the HIGH signals also have a repetitive pattern, however have a Very long length at the end of each section. This is almost a break to separate each section. This is what a single section looks like zoomed in: | |
 | |
SL = [Short LOW] signal. - or short blue bar SH = [Short HIGH] signal - or short yellow bar LL = [Long LOW] signal - or long blue bar LH = [Long HIGH] signal - or long yellow bar VLH = [Very long HIGH} signal - or very long yellow bar (~92 analogReads in length) You will notice that there are only about 6 different combinations of the signals mentioned above. We can use this to create a coding system as described below: | |
 | |
| We can use this coding system to describe the signals. The charts below show the difference between turning the LIGHT ON and LIGHT OFF. | |
 | |
 | |
| PLEASE NOTE: You may notice when you copy the signals from the Serial monitor that you get a series of (0,255) combinations. This is actually a timeout sequence - which generally occurs after the signal is complete. Here is an example of what I mean. | |
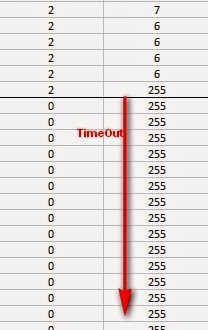 |
This is the end of tutorial 2. In the next tutorial, we will use the code acquired from the remote to turn the FAN LIGHT on and off (using the 433 MHz RF transmitter).
Click here for Tutorial 3
[original story: ScottC]

