Posts with «arduino» label

Soccer Penalty Kicks game with Wiring and Arduino

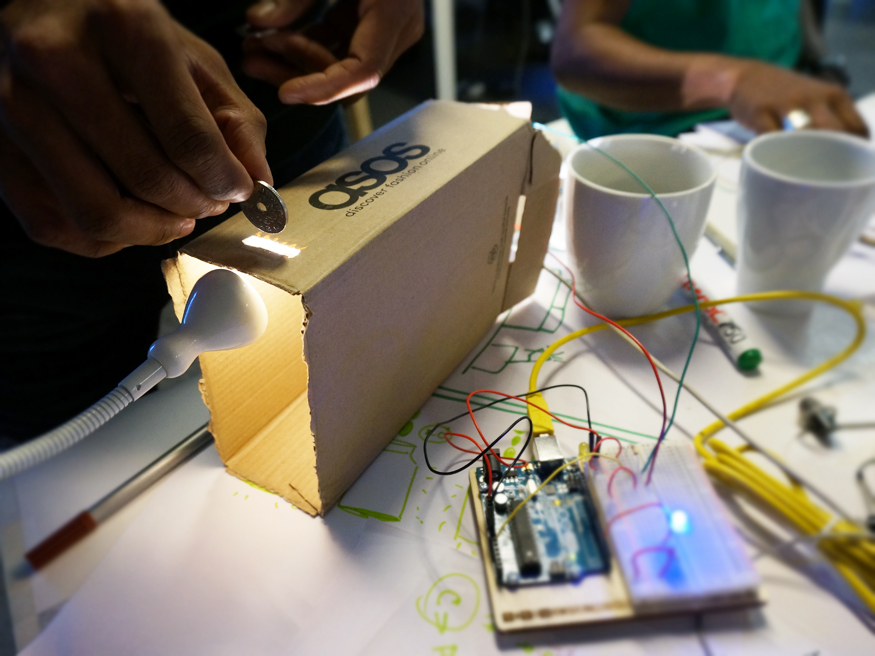
It’s FIFA World Cup time and we have a project for makers who prefer to be active instead of only watching the others play. The exciting penalty shoot-out we’ve always enjoyed in video games was implemented by Germán Carrillo as an electro-mechanical game where you save goals using a control device and kick the ball with your fingers:

It is an interactive game situated between electronics and the real world making you part of the game. The more players the better (we have played 8 people!). The video below shows the construction phase of the project and several sample penalty kicks. The project involves a variety of electronic components such as the Arduino Uno, servos, LEDs, push buttons, a potentiometer, a switch, a piezo buzzer, a gearmotor, and the ATtiny85, among others (great for a first Arduino project, isn’t it?).


Arduino Blog 26 Jun 20:06
arduino  game  soccer  

Making Fun: Kid’s Room Spacecraft

I built a spaceship for my four-year-old's room. It has a control panel full of interesting displays and whiz-bang space sounds. A joystick controls lights and sounds for the engine and thrusters. The payload bay has a motorized hatch and and contains a robot arm for deploying payloads like toy satellites. Headsets provide an audio link between the spacecraft and the Mission Control desk in the other son's room.

Read more on MAKE

433 MHz RF module with Arduino Tutorial 2

Project 2: RF Remote Copy

In the previous project, we transmitted a signal wirelessly from one Arduino to another. It was there to help troubleshoot communication between the modules. It was important to start with a very short distance (1-2 cm) and then move the RF modules further apart to test the range. The range can be extended by soldering an antenna to the module, or by experimenting with different voltage supplies to the modules (making sure to keep within the voltage limits of the modules.)

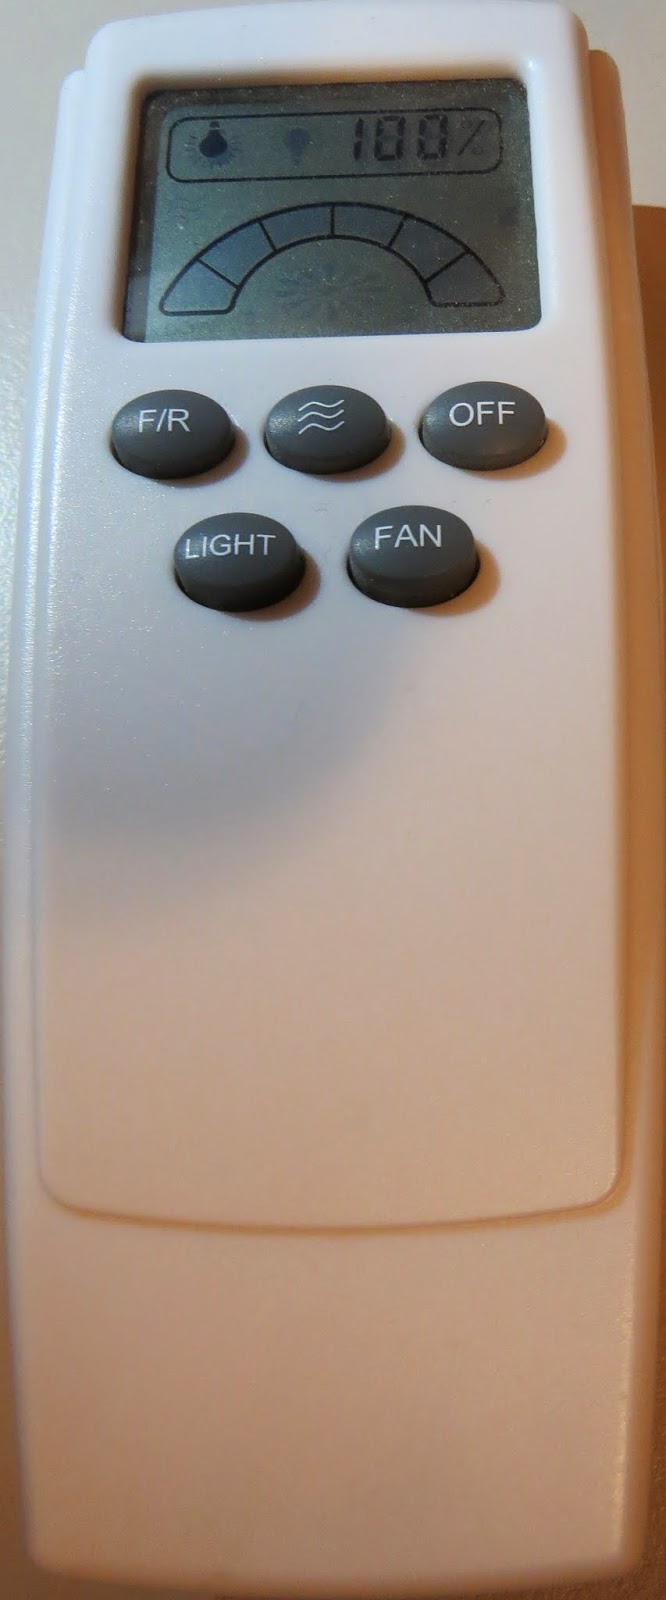
In this project - we aim to receive a signal from an RF remote. The remote that I am using is a Mercator Remote Controller for a Fan/Light. (Remote controller code is FRM94). It is important that you use a remote that transmits at the same frequency as your receiver. In this case, my remote just happens to use a frequency of 433MHz. I was able to receive RF signals from from a distance of about 30cm without an antenna (from my remote to the receiver).


Video


Here are the parts that you will need to carry out this project:
 

Parts Required


Remote Controller

You can quickly test your remote, by pressing one of the buttons in close proximity to the RF receiver (using the same sketch as in Project 1), and you should see the LED flicker on an off in response to the button press. If you don't see the LED flickering, then this project will not work for you.

Here is a picture of the remote controller that I am using:


Arduino Sketch - Remote Receiver

The following sketch will make the Arduino wait until a signal is detected from the remote (or other 433 MHz RF device). Once triggered, it will turn the LED ON, and start to collect and store the signal data into an array.

I did my best to keep the signal reading section of the sketch free from other functions or interruptions.The aim is to get the Arduino to focus on reading ONLY... and once the reading phase is complete, it will report the signal data to the Serial monitor. So you will need to have the Serial monitor open when you press the remote control button.

The remote control signal will be made up of HIGH and LOW signals - which I will try to illustrate later in the tutorial. But for now, all you need to know is that the Signal will alternate between HIGH and LOW signals, and that they can be different lengths.

This sketch aims to identify how long each LOW and HIGH signal is (to make up the complete RF remote signal). I have chosen to capture 500 data points(or 250 LOW/HIGH combinations).You may wish to increase or decrease the dataSize variable to accomodate your specific RF signal. In my case, I only really needed 300 data points, because there was a "flat" signal for the last 200 data points (characterised by 200 repetitions of a LOW signal length of 0 and HIGH signal length of 255)


--------------------------------------------------
 1
2
3
4
5
6
7
8
9
10
11
12
13
14
15
16
17
18
19
20
21
22
23
24
25
26
27
28
29
30
31
32
33
34
35
36
37
38
39
40
41
42
43
44
45
46
47
48
49
50
51
52
53
54
55
56
57
58
59
60
61
62
63
64
65
66
67
68
69
70
71
72
73
74
75
76
77
78
79
80
81
82
83
84
85
86
87


/* 
  RF Remote Capture sketch 
     Written by ScottC 24 Jun 2014
     Arduino IDE version 1.0.5
     Website: http://arduinobasics.blogspot.com
     Receiver: XY-MK-5V
     Description: Use Arduino to Receive RF Remote signal          
 ------------------------------------------------------------- */

 const int dataSize = 500; //Arduino memory is limited (max=1700)
 byte storedData[dataSize]; //Create an array to store the data
 #define ledPin 13           //Onboard LED = digital pin 13
 #define rfReceivePin A0     //RF Receiver data pin = Analog pin 0
 const unsigned int upperThreshold = 100; //upper threshold value
 const unsigned int lowerThreshold = 80; //lower threshold value
 int maxSignalLength = 255; //Set the maximum length of the signal
 int dataCounter = 0; //Variable to measure the length of the signal
 unsigned long startTime=0; //Variable to record the start time
 unsigned long endTime=0; //Variable to record the end time
 unsigned long signalDuration=0; //Variable to record signal reading time
 

 void setup(){
  Serial.begin(9600);
  pinMode(ledPin, OUTPUT);
  
  /* The following code will only run ONCE --------------
  ---Press the reset button on the Arduino to run again-- */
  
  while(analogRead(rfReceivePin)<1){
      //Wait here until a LOW signal is received
      startTime=micros(); //Update start time with every cycle.
  }
  digitalWrite(ledPin, HIGH); //Turn LED ON
  
  
  //Read and store the rest of the signal into the storedData array
  for(int i=0; i<dataSize; i=i+2){
    
    //Identify the length of the LOW signal---------------LOW
    dataCounter=0; //reset the counter
    while(analogRead(rfReceivePin)>upperThreshold && dataCounter<maxSignalLength){
      dataCounter++;
    }
    storedData[i]=dataCounter;
    
    //Identify the length of the HIGH signal---------------HIGH
    dataCounter=0;//reset the counter
    while(analogRead(rfReceivePin)<lowerThreshold && dataCounter<maxSignalLength){
      dataCounter++;
    }
    storedData[i+1]=dataCounter;
    
    //Any readings between the two threshold values will be ignored.
    //The LOW or HIGH signal length must be less than the variable "maxSignalLength"
    //otherwise it will be truncated. All of the HIGH signals and LOW signals combined
    //must not exceed the variable "dataSize", otherwise it will be truncated.
    //The maximum number of signals is 1700 - if you try to extend this variable to a higher
    //number than 1700 - then the Arduino will freeze up and sketch will not work.
    //-------------------------------------------------------------
  }
  
  endTime=micros(); //Record the end time of the read period.
  signalDuration = endTime-startTime;
  
  digitalWrite(ledPin, LOW);//Turn LED OFF
  
  //Send report to the Serial Monitor
  Serial.println("=====================");
  Serial.print("Read duration: ");
  Serial.print(signalDuration);
  Serial.println(" microseconds");
  Serial.println("=====================");
  Serial.println("LOW,HIGH");
  delay(20);
  for(int i=0; i<dataSize; i=i+2){
    Serial.print(storedData[i]);
    Serial.print(",");
    Serial.println(storedData[i+1]);
    delay(20);
  }
 }

 void loop(){
   //Do nothing here
 }


Receiver Fritzing Sketch

Results

After pressing the button on the RF remote, the data signal is printed to the Serial Monitor. You can copy the data to a spreadsheet program for review. This is an example of the signal produced after pushing the button on the remote for turning the fan/light on.
The following code was produced from pushing the button responsible for turning the light off:
The code sequence above may seem a bit random until you start graphing it. I grabbed the LOW column - and produced the following chart:
 
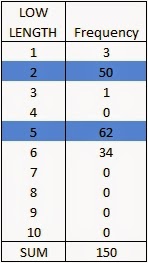
The chart above is a bit messy - mainly because the timing is slightly out... in that sometimes it can squeeze an extra read from a particular signal. But what is important to note here is that you can differentiate a LONG signal from a SHORT signal. I have drawn a couple of red dotted lines where I believe most of the readings tend to sit. I then used a formula in the spreadsheet to calibrate the readings and make them a bit more uniform. For example, if the length of the signal was greater than 4 analogReads, then I converted this to 6. If it was less than 4 analogReads, then I converted it to 2. I used a frequency table to help decide on the cutoff value of 4, and just decided to pick the two values (2 for short, and 6 for long) based on the frequency tables below. I could have chosen 5 as the LONG value, but there were more 6's overall.
 
  **The meaning of "frequency" in the following tables relate to the "number of times" a specific signal length is recorded.

 
And this is the resulting chart:

You will notice that the pattern is quite repetitive. I helped to identify the sections with vertical red lines (near the bottom of the chart). In other words, the signal produced by the remote is repeated 6 times.
I then did the same for the HIGH signal column and combined the two to create the following chart:


You will notice that the HIGH signals also have a repetitive pattern, however have a Very long length at the end of each section. This is almost a break to separate each section.
This is what a single section looks like zoomed in:


SL = [Short LOW] signal. - or short blue bar
SH = [Short HIGH] signal - or short yellow bar
LL = [Long LOW] signal - or long blue bar
LH = [Long HIGH] signal - or long yellow bar
VLH = [Very long HIGH} signal - or very long yellow bar (~92 analogReads in length)

 
  You will notice that there are only about 6 different combinations of the signals mentioned above. We can use this to create a coding system as described below:


We can use this coding system to describe the signals. The charts below show the difference between turning the LIGHT ON and LIGHT OFF.


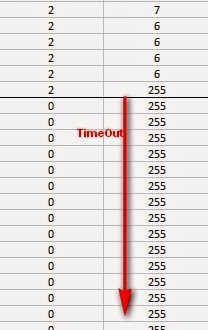
PLEASE NOTE: You may notice when you copy the signals from the Serial monitor that you get a series of (0,255) combinations. This is actually a timeout sequence - which generally occurs after the signal is complete.
 
 Here is an example of what I mean.


This is the end of tutorial 2. In the next tutorial, we will use the code acquired from the remote to turn the FAN LIGHT on and off (using the 433 MHz RF transmitter).

Click here for Tutorial 3

ScottC 26 Jun 18:05

433 MHz RF module with Arduino Tutorial 2


There are 4 parts to this tutorial:
To get the most out of this tutorial - it is best to start at tutorial Part 1, and then progress to Part 2 then Part 3 and then do Part 4 last. Doing the RF tutorials in this order will help you to understand the process better.


Project 2: RF Remote Copy

In the previous project, we transmitted a signal wirelessly from one Arduino to another. It was there to help troubleshoot communication between the modules. It was important to start with a very short distance (1-2 cm) and then move the RF modules further apart to test the range. The range can be extended by soldering an antenna to the module, or by experimenting with different voltage supplies to the modules (making sure to keep within the voltage limits of the modules.)
In this project - we aim to receive a signal from an RF remote. The remote that I am using is a Mercator Remote Controller for a Fan/Light. (Remote controller code is FRM94). It is important that you use a remote that transmits at the same frequency as your receiver. In this case, my remote just happens to use a frequency of 433MHz. I was able to receive RF signals from from a distance of about 30cm without an antenna (from my remote to the receiver).


Video


Here are the parts that you will need to carry out this project:
 

Parts Required


Remote Controller


You can quickly test your remote, by pressing one of the buttons in close proximity to the RF receiver (using the same sketch as in Project 1), and you should see the LED flicker on an off in response to the button press. If you don't see the LED flickering, then this project will not work for you.

Here is a picture of the remote controller that I am using:


Arduino Sketch - Remote Receiver

The following sketch will make the Arduino wait until a signal is detected from the remote (or other 433 MHz RF device). Once triggered, it will turn the LED ON, and start to collect and store the signal data into an array.
I did my best to keep the signal reading section of the sketch free from other functions or interruptions.The aim is to get the Arduino to focus on reading ONLY... and once the reading phase is complete, it will report the signal data to the Serial monitor. So you will need to have the Serial monitor open when you press the remote control button.
The remote control signal will be made up of HIGH and LOW signals - which I will try to illustrate later in the tutorial. But for now, all you need to know is that the Signal will alternate between HIGH and LOW signals, and that they can be different lengths.
This sketch aims to identify how long each LOW and HIGH signal is (to make up the complete RF remote signal). I have chosen to capture 500 data points(or 250 LOW/HIGH combinations).You may wish to increase or decrease the dataSize variable to accomodate your specific RF signal. In my case, I only really needed 300 data points, because there was a "flat" signal for the last 200 data points (characterised by 200 repetitions of a LOW signal length of 0 and HIGH signal length of 255)

--------------------------------------------------


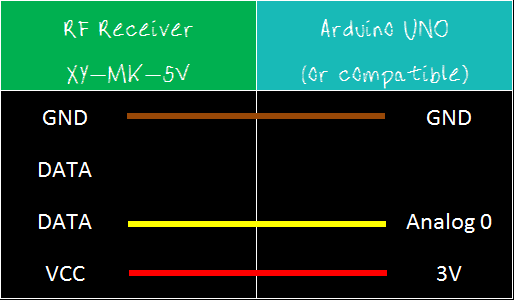
Receiver Fritzing Sketch


Results

After pressing the button on the RF remote, the data signal is printed to the Serial Monitor. You can copy the data to a spreadsheet program for review. This is an example of the signal produced after pushing the button on the remote for turning the fan/light on.
The following code was produced from pushing the button responsible for turning the light off:
The code sequence above may seem a bit random until you start graphing it. I grabbed the LOW column - and produced the following chart:
The chart above is a bit messy - mainly because the timing is slightly out... in that sometimes it can squeeze an extra read from a particular signal. But what is important to note here is that you can differentiate a LONG signal from a SHORT signal. I have drawn a couple of red dotted lines where I believe most of the readings tend to sit. I then used a formula in the spreadsheet to calibrate the readings and make them a bit more uniform. For example, if the length of the signal was greater than 4 analogReads, then I converted this to 6. If it was less than 4 analogReads, then I converted it to 2. I used a frequency table to help decide on the cutoff value of 4, and just decided to pick the two values (2 for short, and 6 for long) based on the frequency tables below. I could have chosen 5 as the LONG value, but there were more 6's overall.

  **The meaning of "frequency" in the following tables relate to the "number of times" a specific signal length is recorded.


And this is the resulting chart:

You will notice that the pattern is quite repetitive. I helped to identify the sections with vertical red lines (near the bottom of the chart). In other words, the signal produced by the remote is repeated 6 times.
I then did the same for the HIGH signal column and combined the two to create the following chart:


You will notice that the HIGH signals also have a repetitive pattern, however have a Very long length at the end of each section. This is almost a break to separate each section.
This is what a single section looks like zoomed in:


SL = [Short LOW] signal. - or short blue bar
SH = [Short HIGH] signal - or short yellow bar
LL = [Long LOW] signal - or long blue bar
LH = [Long HIGH] signal - or long yellow bar
VLH = [Very long HIGH} signal - or very long yellow bar (~92 analogReads in length)


  You will notice that there are only about 6 different combinations of the signals mentioned above. We can use this to create a coding system as described below:


We can use this coding system to describe the signals. The charts below show the difference between turning the LIGHT ON and LIGHT OFF.


PLEASE NOTE: You may notice when you copy the signals from the Serial monitor that you get a series of (0,255) combinations. This is actually a timeout sequence - which generally occurs after the signal is complete.

 Here is an example of what I mean.


This is the end of tutorial 2. In the next tutorial, we will use the code acquired from the remote to turn the FAN LIGHT on and off (using the 433 MHz RF transmitter).

Click here for Tutorial 3

ScottC 26 Jun 18:05

An interactive coin jar saving for a good cause

At the end of May, Massimo Banzi and Giorgio Olivero (Todo) spent some days at the Copenhagen Institute of Interaction Design to teach a class called Connected Objects. The class goal was to envision, design and implement interactive objects that are open and connected, whose design and behaviour can be used to sense, read and affect the domestic landscape or other shared environments.

One of the team of students (Arun Mota, Hsiang-Lin Yang, Yashodeep Gholap) worked on Arduino Yún to create an energy redistribution service that allows people to save money and in parallel donate towards energy distribution projects in deprived areas of the world:

LightUp is an interactive fundraising coin jar that firstly encourages personal savings and then also allows people to contribute a part of their savings towards the cause. The system allows them to track in real-time exactly how many units of electricity they helped generate. Another visible reward is the jar lights up for 10 minutes each time they drop a coin.

To avail the service of LightUp, a user merely needs to register through an online platform. Every registered user is then provided with a physical jar to make savings on periodical basis. Users can save coins in these jars. Every time a coin is dropped in it, as a response the jar lights up for 10 minutes.

The drop of a coin each time also triggers a parallel transaction where a certain sum of money is transferred from the user’s account to LightUp’s Account. While registering, LightUp will also create a personal PayPal account for its users. This PayPal account is linked to the merchant PayPal account of LightUp. The user gets to decide the unit of money that can be debited each time while registering.

Every time users put coins in the LightUp jar, they will also receive immediate feedbacks such as SMS, email or facebook notification as per user’s preferences. These feedbacks will inform users on how their donation is being used for specific social projects and how they have helped make a real difference.


Arduino Blog 25 Jun 19:41

Wireless Controlled Robotic Hand made with Arduino Lilypad

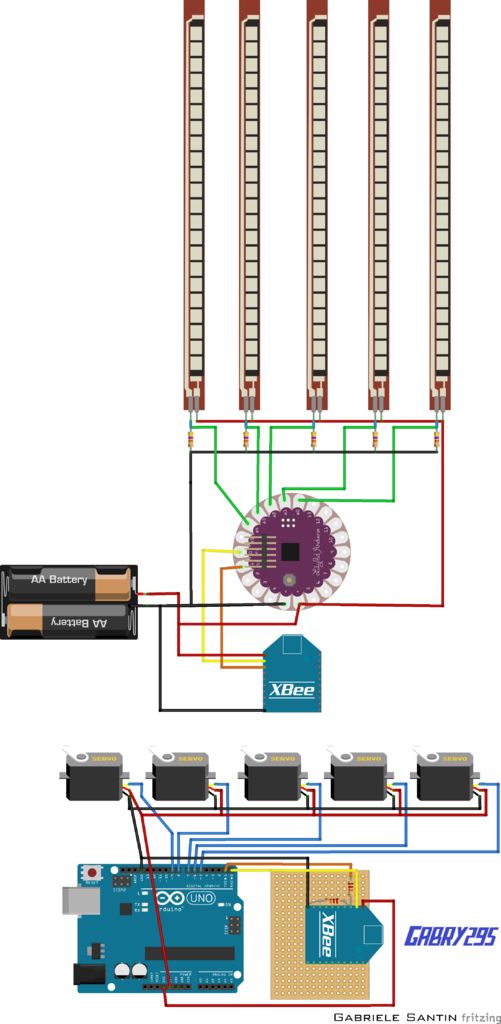
Gabri295 published on Instructable a tutorial for a project created during his last year of high school.  It’s  an artificial hand controlled by a glove with 5 flex sensors and Arduino Lilypad . The artificial hand reproduces the movements of the hand wearing the glove.

The components you need to control glove are:
• an elastic glove;
• Lilypad Arduino board (there are different versions, which usually only have 4 analog inputs, so pay attention and buy the one in the image);
• Shield to connect the Xbee module;
• 5 Flex sensors;
• 5 resistors: 47 K?;
• battery pack with 3×1.5 V batteries (Lilypad can be powered from 2.7 to 5.5 V, so 4.5 V it’s ok);
• LilyPad FTDI adapter (quite optional).

The materials needed for the robotic hand are:

• a steel structure for the palm of the hand and wood for the fingers;
• Arduino UNO board;
• 5 servomotors;
• to connect the servomotors I used the Robot_Shield from FuturaElettronica, which has also a switching regulator to power the entire circuit, but you can use any shield made for that;
• Shield to connect the XBee module (I made an horrible one, but it’s economic and I needed to make it small because of the size of the Robot_Shield, you can buy even XBee shields which have also pins to connect the servomotors);
• fishing wires;
• 9 V Battery.

Below you can take a look at the schematic and then follow the steps to make one yourself!


Arduino Blog 24 Jun 21:46

The 200 LED Ring Clock

There are LED clocks, and then there are LED clocks that can blind you from 30 paces. [Stiggalicious's] LED ring clock is of the latter variety. 200 WS2812B/Neopixel RGB LEDs drive the ring clock to pupil searing levels. The clock runs on ATMega1284P, with timekeeping handled by an NXP PCF8563 real-time clock chip. Code is written in Arduino’s wiring language using Adafruit’s Neopixel library.

Building the clock with a single Printed Circuit Board (PCB) would be both expensive and wasteful. [Stiggalicious] cleverly designed his clock to be built with 8 copies of the same PCB. Each board makes up a 45° pie slice of the ring. All 8 PCBs have footprints for the CPU, clock chip, and other various discrete parts, but only the “master” section has these parts populated. 7 “slave” sections simply pass clock, data, power and ground through each LED. He used Seeedstudio’s board service to get 10 copies of his PCB made, just in case there were any mistakes.

[Stiggalicious] rolled the dice by buying exactly the 200 LEDs he needed. Either he got really lucky, or the WS2812 quality testing has improved, because only one LED had a dead blue LED.

If you’d like to find out more, [Stiggalicious] gives plenty of details in his Reddit thread. He doesn’t have a webpage setup for the clock but he’s uploaded his source code (pastebin link) and Altium schematic/PCB files (mega.nz link). We may be a bit biased, but hackaday.io would be a perfect spot for this or any other project!


Filed under: clock hacks, led hacks
Hack a Day 24 Jun 12:00

Monitoring glaciers at the Venice 14th International Architecture Exhibition

Glaciers are the largest moving objects on earth and the  glacier on the Austria’s sixth highest summit called Simulaun  is the protagonist of an installation awarded a Special Mention by the Jury of the 14th International Architecture Exhibition of La Biennale di Venezia.

On May 4th, 2014, the Italian Limes team installed a network of solar-powered GPS units on the surface of the Similaun glacier, following a 1-km-long section of the border between Italy and Austria, in order to monitor the movements of the ice sheet throughout the duration of the exhibition at the Corderie dell’Arsenale.

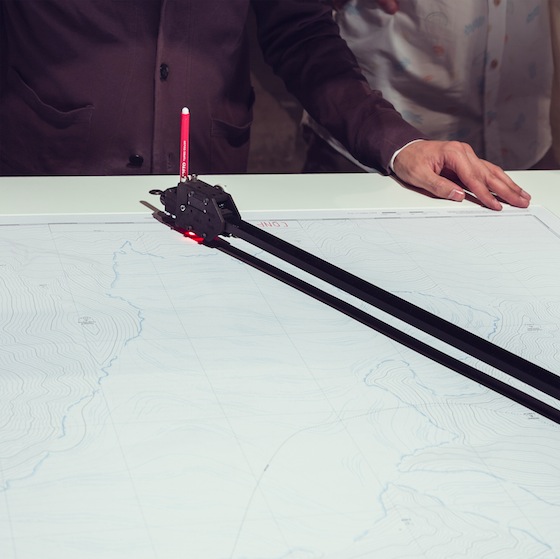
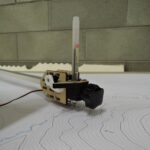
The geographic coordinates collected by the sensors are broadcasted and stored every hour on a remote server via a satellite connection. An automated drawing machine—controlled by an Arduino board and programmed with Processing—has been specifically designed to translated the coordinates received from the sensors into a real- time representation of the shifts in the border. The drawing machine operates automatically and can be activated on request by every visitor, who can collect a customized and unique map of the border between Italy and Austria, produced on the exact moment of his visit to the exhibition.

Italian Limes is a project by Folder (Marco Ferrari, Elisa Pasqual) with Pietro Leoni (interaction design), Delfino Sisto Legnani (photography), Dawid Górny, Alex Rothera, Angelo Semeraro (projection mapping), Alessandro Mason (production coordination), Claudia Mainardi.
Italian Limes has been supported by Fablab Torino, Favini, FaberSum, Intergrafica Verona, LAC–Litografia Artistica Cartografica.

Read the Press release >>


Arduino Blog 23 Jun 11:10

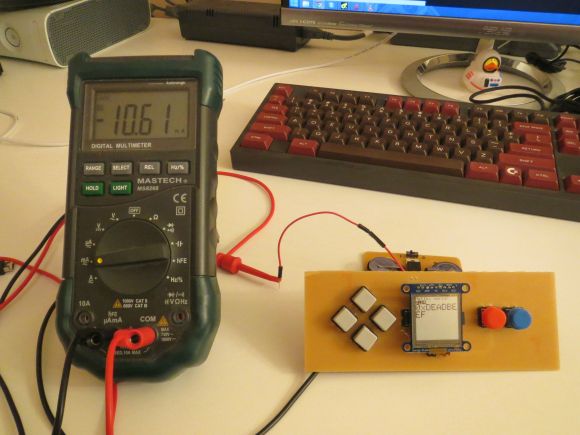
Handheld Game System Powered by Arduino

These days, it’s easy enough to play games on the go. If you have a smart phone, you are pretty much set. That doesn’t mean you can’t still have fun designing and building your own portable gaming system, though.

[randrews] did just that. He started out by purchasing a small memory LCD display from Adafruit. The screen he chose is low power as far as screens go, so it would be a good fit for this project. After testing the screen with a quick demo program, it was time to start designing the circuit board.

[randrews] used Eagle to design the circuit. He hand routed all of the traces to avoid any weird issues that the auto router can sometimes cause. He made an efficient use of the space on the board by mounting the screen over top of the ATMega chip and the other supporting components. The screen is designed to plug in and out of the socket, this way it can be removed to get to the chip. [randrews] needs to be able to reach the chip in order to reprogram it for different games.

Once the board design was finished, [randrews] used his Shapeoko CNC mill to cut it out of a copper clad board. He warns that you need to be careful doing this, since breathing fiberglass dust is detrimental to living a long and healthy life. Once the board was milled out, [randrews] used a small Dremel drill press to drill all of the holes.

The final piece of the puzzle was to figure out the power situation. [randrews] designed a second smaller PCB for this. The power board holds two 3V coin cell batteries. The Arduino expects 5V, so [randrews] had to use a voltage regulator. This power board also contains the power switch for the whole system.

The power board was milled and populated. Then it was time to do some measurements. [randrews] measured the current draw and calculates that he should be able to get around 15 hours of play time using the two 3V coin cell batteries. Not bad considering the size.

[via Reddit]


Filed under: Arduino Hacks
Hack a Day 23 Jun 06:00

433 MHz RF module with Arduino Tutorial 1


There are 4 parts to this tutorial:

To get the most out of this tutorial - it is best to start at tutorial Part 1, and then progress to Part 2 then Part 3 and then do Part 4 last. Doing the RF tutorials in this order will help you to understand the process better.


If you are looking for a way to communicate between Arduinos, but don't have much cash at your disposal, then look no further. These RF modules are not only affordable, but easy to use. They are much easier to set up than an XBee, plus you can use them without the need of a special shield. Before you rush out and buy a ton of these modules, make sure that you are not breaking any radio transmission laws in your country. Do your research, and buy them only if you are allowed to use them in your area. There are a few [OPTIONAL] libraries that can be used to help you and your particular project.


I will mention at this point however, that I did NOT use any libraries in this particular tutorial. That's right. I will show how easy it is to transmit data from one arduino to another using these RF modules WITHOUT libraries.

Also if you are looking for an easy way to record the signals and play them back without a computer - then jump to this tutorial.

Video


Project 1- RF Blink


Firstly we need to test if the RF modules are working. So we will design a very simple transmit and receive sketch to test their functionality. We will use the Arduino's onboard LED to show when the transmitter is transmitting, and when the other Arduino is receiving. There will be a slight delay between the two Arduinos. You can solder an antenna onto these modules, however I did not do this, I just kept the modules close together (1-2cm apart). I also found that I was getting better accuracy when I used 3V instead of 5V to power the receiver. While using 5V for VCC on the receiver, I would get a lot of interference, however with 3V, I hardly got any noise. If you find you are getting unpredictable results, I would suggest you switch to 3V on the receiver and move the transmitter and receiver modules right next to each other. Remember this is just a check... you can experiment with an antenna or a greater distance afterwards.

Here are the parts that you will need to carry out this project:
 

Parts Required


The Transmitter and Receiver Fritzing Sketch


The Transmitter

The transmitter has 3 pins


 Notice the pin called "ATAD". It took me a while to figure out what ATAD stood for, when I suddenly realised that this was just a word reversed. It should be DATA (not ATAD). Nevertheless, this is the pin responsible for transmitting the signal. We will make the Arduino's onboard LED illuminate when the transmitter pin is HIGH, and go off when LOW as described in the following table.


And this is the Arduino Sketch to carry out the data transmission.


Arduino sketch - Transmitter


The Receiver


If all goes to plan, the onboard LED on this Arduino should light up (and go off) at the same time as the onboard LED on the transmitting Arduino. There is a chance that the receiver may pick up stray signals from other transmitting devices using that specific frequency. So you may need to play around with the threshold value to eliminate the "noise". But don't make it too big, or you will eliminate the signal in this experiment. You will also notice a small delay between the two Arduinos.


Arduino sketch - Receiver


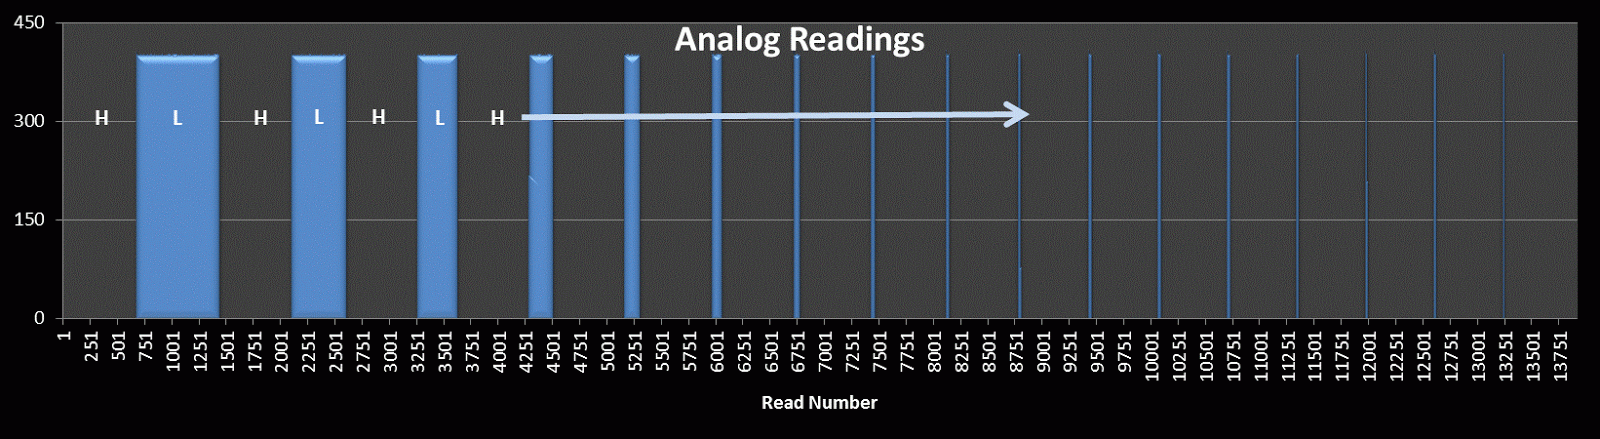
When a HIGH signal is transmitted to the other Arduino. It will produce an AnalogRead = 0.
When a LOW signal is transmitted, it will produce an AnalogRead = 400.
This may vary depending on on your module, and voltage used.
The signals received can be viewed using the Serial Monitor, and can be copied into a spreadsheet to create a chart like this:


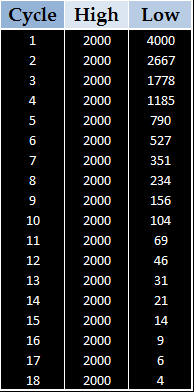
You will notice that the HIGH signal (H) is constant, whereas the LOW signal (L) is getting smaller with each cycle. I am not sure why the HIGH signal produces a Analog reading of "0". I would have thought it would have been the other way around. But you can see from the results that a HIGH signal produces a 0 result and a LOW signal produces a value of 400 (roughly).


Tutorial 2

In tutorial 2, we will receive and display a signal from a Mercator RF Remote Controller for Fan/Light.


Tutorial 3

In tutorial 3 - we use the signal acquired from tutorial 2, and transmit the signal to the fan/light to turn the light on and off.


Tutorial 4

In tutorial 4 - we use the information gathered in the first 3 tutorials and do away with the need for a computer. We will listen for a signal, store the signal, and then play it back by pressing a button. Similar to a universal remote ! No libraries, no sound cards, no computer. Just record signal and play it back. Awesome !!


If you like this page, please do me a favour and show your appreciation :

  Visit my ArduinoBasics Google + page.
Follow me on Twitter by looking for ScottC @ArduinoBasics.
Have a look at my videos on my YouTube channel.


However, if you do not have a google profile...
Feel free to share this page with your friends in any way you see fit.


© Copyright by ScottC