Pressure sensor with air pump
I’ve been thinking of expanding the pressure sensor lab for the Applied Circuits Course to do something more than just measure breath pressure. Perhaps something that conveys another physics or engineering concept.
One thing I thought of doing was measuring the back pressure and air flow on an aquarium air pump bubbling air into an aquarium. Looking at the tradeoff of flow-rate and back pressure would be a good characterization of an air pump (something I wish was clearly shown in advertisements for aquarium air pumps and air stones). Measuring flow rate is a bit of a pain—about the best I could think of was to bubble air into an inverted soda bottle (or other known volume) and time it.
This would be a good physics experiment and might even make a decent middle-school product-science science fair project (using a cheap mechanical low-pressure gauge, rather than an electronic pressure sensor), but setting up tanks of water in an electronics lab is a logistic nightmare, and I don’t think I want to go there.
I can generate back pressure with just a simple clamp on the hose, though, and without a flow rate measurement we could do everything completely dry.
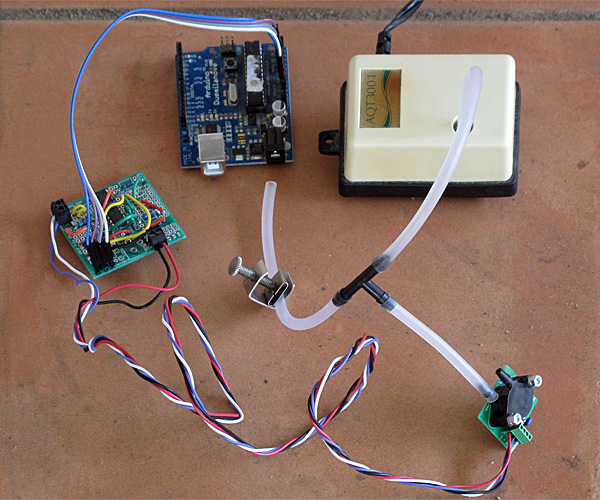
Setup for measuring the back pressure for an aquarium air pump (needs USB connection for data logger and power).
Using the Arduino data loggger my son wrote, I recorded the air pressure while adjusting the clamp (to get the y-axis scale correct, I had to use the estimated gain of the amplifier based on resistor sizes used in the amplifier).
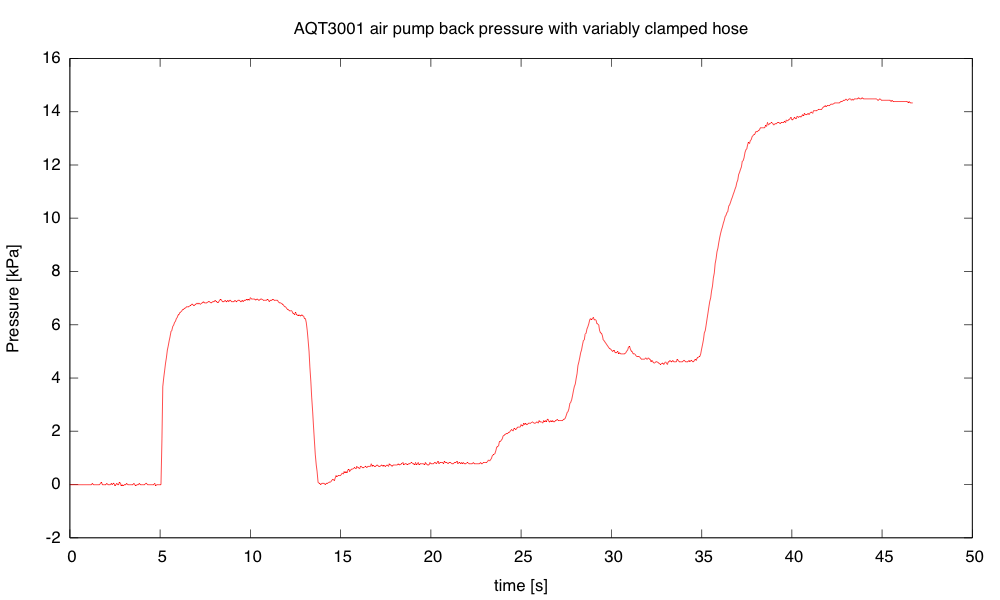
The peak pressure, with the clamp sealing the hose shut, seems to be about 14.5 kPa (2.1psi).
I was interested in the fluctuation in the pressure, so I set the clamp to get about half the maximum back pressure, then recorded with the Arduino data logger set to its highest sampling frequency (1ms/sample).
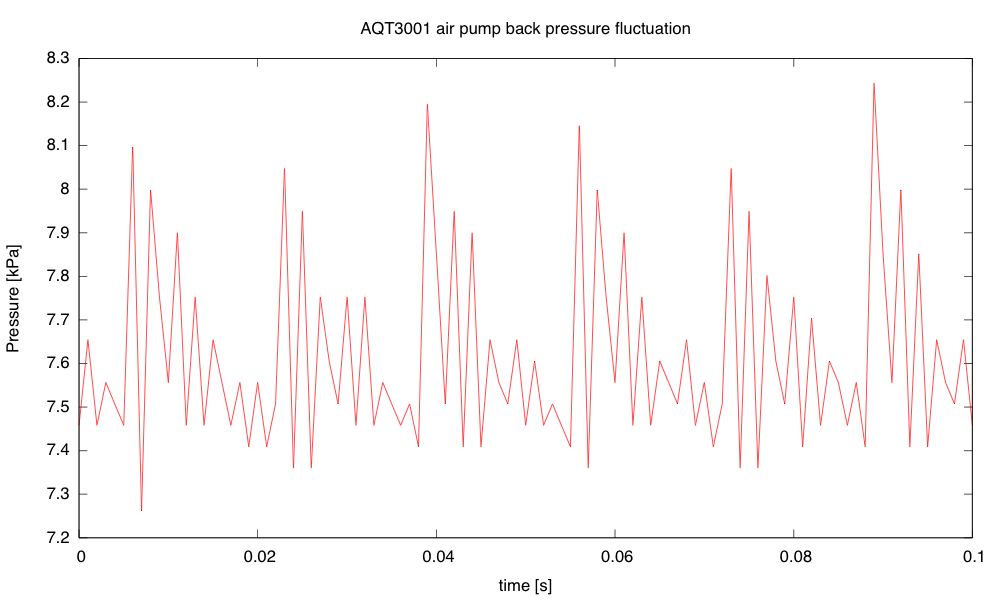
The fluctuation in back pressure seems to have both a 60Hz and a 420Hz component with back pressure at about half maximum.
Because the Arduino data logger has trouble dealing with audio frequency signals, I decided to take another look at the signals using the Bitscope pocket analyzer.
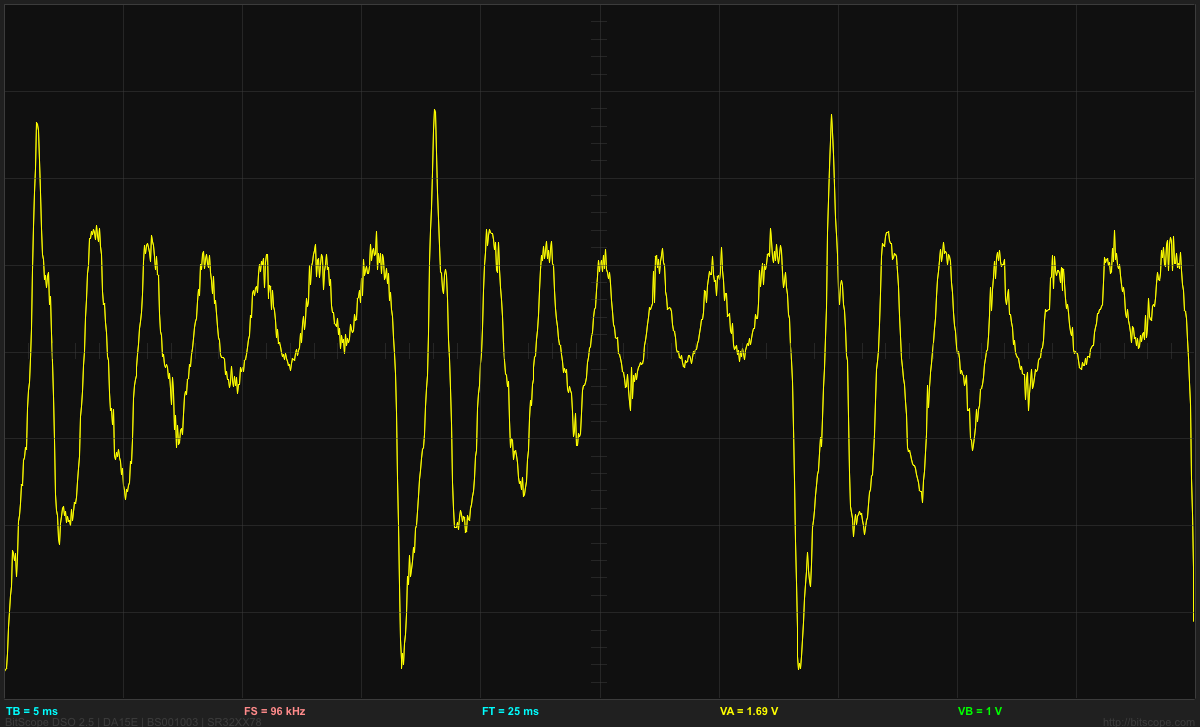
The waveform for the pressure fluctuations from the AQT3001 air pump, with the back pressure about 7.5kPa (half the maximum).
One advantage of using the Bitscope is that it has FFT analysis:
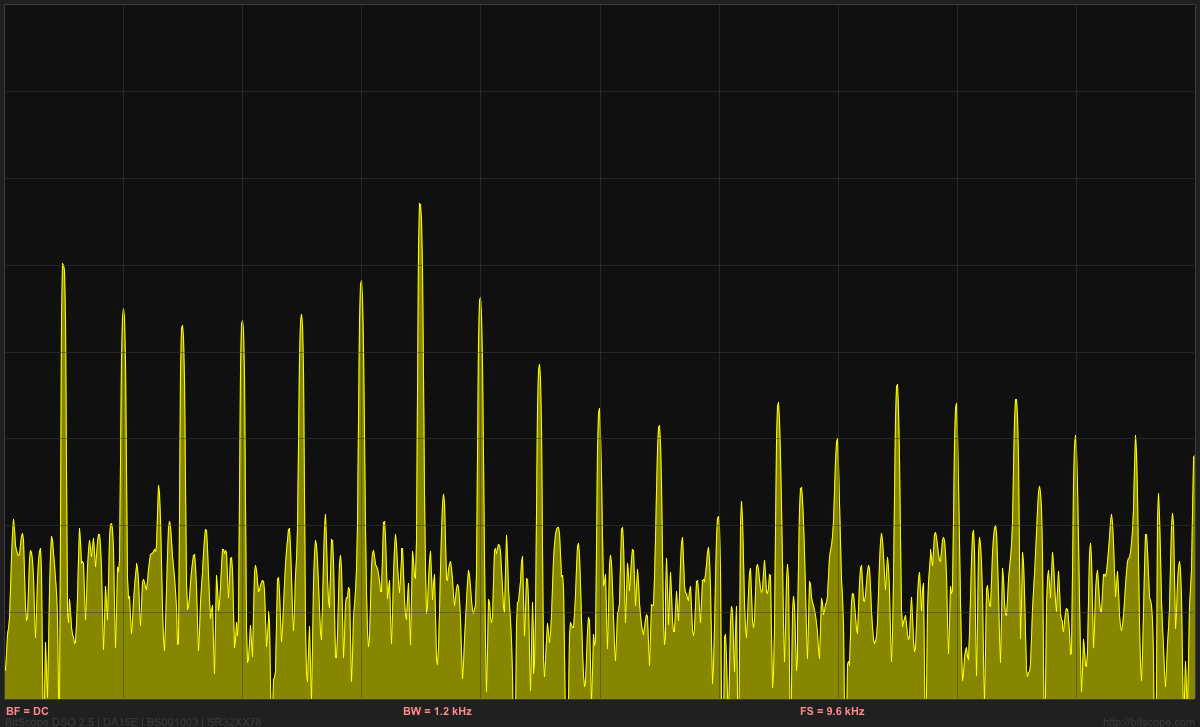
Spectrum for the back pressure fluctuation. One can see many of the multiples of 60Hz, with the particularly strong peak at 420Hz.
I was also interested in testing a Whisper40 air pump (a more powerful, but quieter, pump). When I clamped the hose shut for that air pump, the hi-gain output of the amplifier for the pressure sensor saturated, so I had to use the low gain output to determine the maximum pressure (24.8kPA, or about 3.6psi). The cheap Grafco clamp that I used is a bit hard to get complete shutoff with (I needed to adjust the position of the tubing and use pliers to turn the knob). It is easy to get complete shutoff if the tube is folded over, but then modulation of less than complete shutoff is difficult.
The fluctuation in pressure shows a different waveform from the AQT3001:
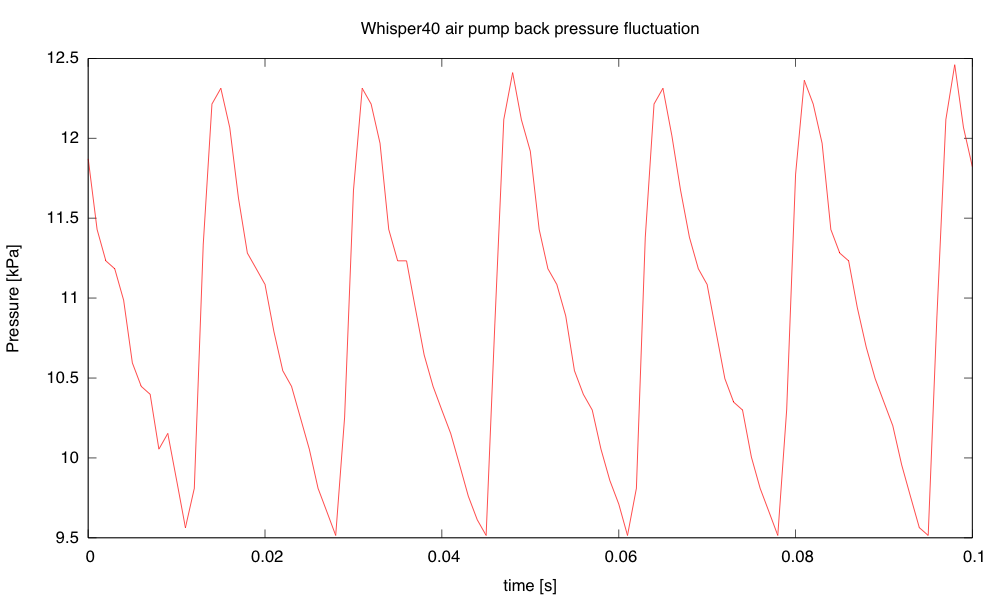
The Whisper40 air pump, with the clamp set to get a bit less than half the maximum back pressure, produces a 60Hz sawtooth pressure waveform, without the strong 420Hz component seen from the AQT3001. The peak-to-peak fluctuation in pressure seems to be largest around this back pressure. The 3kPa fluctuation is larger than for the AQT3001, but the pump seems quieter.
The main noise from the pump is not from the fluctuation in the pressure in the air hose, but radiation from the case of the pump. That noise seems to be least when the back pressure is about 1.1kPa (not at zero, surprisingly). The fluctuation is then all positive pressure, ranging from 0 to 2.2kPa and is nearly sinusoidal, with some 2nd and 3rd harmonic.
As the back pressure increases for the Whisper40, the 2nd, 3rd, and 4th harmonics get larger, but the 60Hz fundamental gets smaller. The 4th harmonic is maximized (with the 1st through 4th harmonics almost equal) at about 22.8kPa, above which all harmonics get smaller, until the air hose is completely pinched off and there is no pressure variation.
When driving the large airstone in our aquarium, the Whisper40 has a back pressure of about 7.50kPa (1.1psi) with a peak-to-peak fluctuation of about 2.6kPa.
I’m not sure whether this air-pump back-pressure experiment is worth adding to the pressure sensor lab. If I decide to do it, we would need to get a dozen cheap air pumps. The Tetra 77853 Whisper 40 air pump is $11.83 each from Amazon, but the smaller one for 10-gallon aquariums is only $6.88. With 12 Ts and 12 clamps, this would cost about $108, which is not a significant cost for the lab.
Filed under: Circuits course, Data acquisition, Pressure gauge Tagged: air pump, Arduino, BitScope, circuits, data acquisition, data logger, instrumentation amp, oscilloscope, pressure sensor, science fair, USB oscilloscope