Fifth day of freshman design seminar
Today we continued the design exercise I started last week (see also 4th class) designing a photospectrometer.
I started the class by collecting the work I had asked them to do on fleshing out the design of the photospectrometer, which I have not read yet. Just glancing at the pile, it looks like most wrote very little, and just drew a picture of the components we talked about in class, not adding much. I’ll know more about the class once I’ve had a chance to look at what they did more carefully. I have asked them to mail their work to the class e-mail list by tomorrow night, so that the rest of the class can see what everyone has done.
I then told them that we’d do some electronics and computer programming, since many of them had requested that on the first-day survey, and that we’d use Arduino boards to do that learning. I suggested that they get Arduino Uno Rev 3 boards as being the current standard (about $30), but told them that almost any Arduino board that used an ATMega processor would be fine—the older boards, like a Uno that is not Rev 3, are often half the price. They can probably get the boards from the University through BELS (the lab support group for the engineering labs), but it might be cheaper on line.
I then asked them for some details that they had added to the photospectrometer design. The first one to come up was the photodetector, so we started talking about different photodetectors. They came up with photodiode, photomultiplier, and photocell, to which I added phototransistor and photoresistor. I asked them what sort of characteristics might be important to a photodetector, and (with some prompting) got them to come up with the ideas of sensitivity and which wavelengths the detector was sensitive to.
One student came up with “resolution” for the sensor, and I took that as an opportunity for a digression into the differences between accuracy, precision, and resolution. I also talked about resolution being a property of the whole system (how many digits were in the numbers), but that there was a property of sensors that was related—how much noise they had. Sometime later in the class (I forget exactly when), I talked about Arduinos having a 10-bit analog-to-digital converter, and asked them to guess what that meant. The only guess was that it meant that there were 10 different levels. I was actually fairly pleased with this answer, as it got to the notion of resolution, and I could correct it from 10 to 210 without making anyone feel stupid. I told them that they should remember 210=1024, as that was a frequently used “magic” number in computers.
I quickly sketched rough sensitivity plots for phototransistors/photodiodes and photoresistors, and explained that that was why photoresistors were used as ambient light sensors—because of how they matched human visual sensitivity. I also mentioned the slowness of photoresistors and said that they weren’t used for much for other applications.
I told them how to find datasheets—either by Googling “photodiode data sheet” or by doing a search on Digi-key, choosing the cheapest part that seemed to do what they want, and looking up its data sheet. I assigned them the task of finding and trying to read a photodiode and a phototransistor data sheet. I’ll make that more explicit on the class web page later tonight. I’ll probably give them a part number for one, and make them look for the other from just a description.
I showed them the schematic symbol for a phototransistor (though, unfortunately, not for a photodiode), but I didn’t attempt to explain how it works. I just told them that the current through the phototransistor was proportional to the light intensity as long as voltage across the transistor was at least 0.7v. (I’ll have to tell them where to find that information on the data sheet.) I also mentioned the notion of “dark current”, which prevents the phototransistor from getting down to 0 current.
I then tried to get them to figure out how to convert the current into a voltage that could be measured by the Arduino. After a few tries, one of them finally remembered Ohm’s Law (V=IR), and they decided they needed a resistance. I told them that there were fairly constant resistance devices available (called “resistors”) and mentioned the notions of resistor tolerance and that resistors had thermal coefficients, so that the resistance changed as a function of temperature.
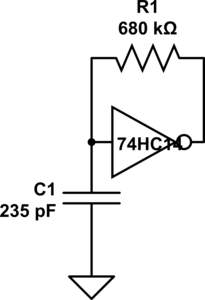
I then gave them the phototransistor circuit below (though not the photodiode circuit):
Simple circuits for measuring light with an Arduino. Update 2014 Feb 6: Q1 is intended to be an NPN phototransistor, not PNP as shown here!
We then spent a fairly long time before they figured out that they needed to know what value resistor to use in the circuit. I got them (eventually) to the point where they realized that the maximum light intensity determined the maximum current, and if we set the maximum voltage to be as high as possible while keeping the transistor properly biased, the desired resistor was determined by R=Vmax/Imax. I showed them how increasing the value of R made the circuit more sensitive, but that if we made R too big the circuit would not be able to handle high light intensity.
We then looked at the overall spectrometer design, and saw how the optics coupled everything together: the brightness of the light, the absorbance of the sample, the efficiency of the monochromator, and the sensitivity of the photodetector. I introduced the notion of interface specifications, so that design problems could be divided up among a team, and the need for negotiating changes to the interface specs rather than just “throwing problems over the fence” for some other part of the team to solve. I gave the example of the lamp designer finding out that the initial spec called for an expensive, bright light (like and HID bulb) but being able to reduce the cost and power enormously with a somewhat less bright LED. The change to the spec might be accommodated by shortening the optical path in the sample (but that would need non-standard cuvettes) or by making the light sensor more sensitive (which is pretty cheap to do).
We ran out of time then, so did not get to looking at any other parts of the design.
Some of the students were amazed at how much thinking went into just one little detail of the design (one resistor value). They are used to big-picture, fuzzy thinking, where getting the general idea is what is important, and are not used to sweating the details. Part of getting them to “think like engineers” is getting them to realize that the details do matter.
For homework, I’ll ask them to figure out good values for R1 and R2 for particular parts (or maybe for one part that I specify and one that they choose), based on the data sheets and some light spec. In class on Monday, I’ll build the design they specified, and we’ll test it with the Arduino data logger. If I happen to pick a bad resistor choice, either because I gave them a bad light intensity to design for or because their math was wrong, we’ll get bad results, and I’ll show them how to debug the design and iteratively improve it.
Filed under: freshman design seminar Tagged: Arduino, bioengineering, engineering education, photodiode, phototransistor, spectrometer, spectrophotometer, spectroscope