Posts with «teaching» label

Capacitive sensing with op amps, continued

What more can I do (or, more importantly, have the students do with the Capacitive sensing with op amps?

The circuit that I gave in that post has several parameters.  Perhaps the students should try predicting what happens when they are adjusted.
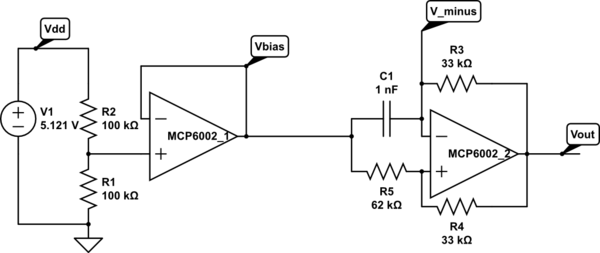
Op amp multivibrator. The first op amp is just to set up a virtual ground halfway between the power rails. The second op amp does the oscillating (at about 8.12 kHz for these components). Circuit drawn with CircuitLab, which is not capable of simulating it.

For example, what happens if Vbias is raised or lowered? What is the effect of changing each of the resistors? How can we optimize the circuit for easy, reliable detection of touches with an Arduino pulseIn() measurement?

If we pretend that the output is a rail-to-rail square wave (ignoring the slew rate limitation), analysis is pretty easy.

.

  • If the output is low, then and Vminus is higher than that, but dropping.
  • If the output is high, then and Vminus is lower than that, but rising.

If we define , we can simplify further and say that Vminus swings between two threshold voltages:   and .

The discharging curve is simply , where , so it takes to discharge to the other threshold.

The charging curve is , and so it takes . That is, .

If we want a symmetric waveform, we need to have , which in turn requires . Raising Vbias makes the low part of the output waveform shorter and the high part longer. Conversely, lowering Vbias makes the low part longer and the high part shorter.

The total period is  .  If we set Vbias to Vdd/2, then we can simplify further to .

The sum R4+R5 only affects the amount of current that the Vbias supply has to provide, but it is probably a good idea to make it fairly large, and to add a bypass capacitor to Vbias, to prevent noise coupling though the bias supply.

When using pulseIn() on the Arduino to measure the capacitance C1, we want to have a large change in the pulse duration (to avoid quantization effects from reporting the duration in μsec), which means a large value for R3. That is limited by the problem of picking up 60Hz noise if the input impedance is too high.

We can also tweak r=R5/R4 a little, to make the period a larger multiple of τ, limited by the problem of noise if we get the thresholds too close to the rails.

Since pulseIn() only measures one part of the waveform (the low part or the high part), we could also tweak the bias voltage to lengthen just that part of the waveform, for example, dropping Vbias to Vdd/4 to length the low part.  We again have to be careful not to get the threshold too close to the rails.  If we are lowering Vbias, then the threshold to watch is . If we fix as low as we’re willing to make it, then should we make Vbias low or r high?  The number we are trying to maximize is the discharge time , with the constraint that . At equality, we have to maximize , which is achieved by making r as large as possible.  Of course, that would mean raising Vbias, which would run us into trouble with noise at the other threshold.  In general, it seems like the symmetric waveform with Vbias=Vdd/2 gives us the best noise margins.

Next step: how do we either slow down the oscillator or clean up the waveform enough to get a good signal to feed into the Arduino?

I tried increasing both R1 and R5, while decreasing R4, as shown below.

Modified circuit for longer period. C1 is just the stray capacitance of the touch sensor, with no deliberately added capacitance.

This circuit oscillates with a frequency of 35.66 kHz (period of about 28 µsec )when the touch sensor is not touched, which is slow enough that the signal runs from rail to rail. Touching the sensor drops the frequency to 20kHz or less (period of 50 µsec or more). Since r=5.556, the expected period is 4.988 τ, or 0.4988 µsec/pF C1.  The period is consistent with a stray capacitance of 56 pF, increasing to over 100 pF when the sensor is touched.  There is a lot of jitter in the lower-frequency signal, probably due to some coupling of 60 Hz noise into the system. A 1nF capacitor for C1 gives a frequency of 1660Hz (602 µsec, which is more than the expected 500 µsec), 47nF gives 34.65 Hz (28.86 msec, not the expected 23.44 msec).  Why am I consistently 25% off?

The change of 20 µsec or more in the period (10 µsec or more in the half period) should be easily detectable with one pulseIn() measurement on the Arduino.  The following code seems to work fairly well, with a light touch causing the LED to flash (right on the edge of detection) and a firmer touch giving a steady reading.

// Capacitive sensor switch
// Thu Jul 12 21:36:42 PDT 2012 Kevin Karplus

// To use, connect the output of the op-amp oscillator to
// pin CAP_PIN on the Arduino.
// The code turns on the LED on pin 13 when a touch is sensed.

// The Arduino measures the width of one LOW pulse on pin CAP_PIN.
// The LED is turned on if the pulse width is more than min_pulse_usec

// pin that oscillator output connected to
#define CAP_PIN (2)

// time (in milliseconds) to wait after a change in state before
// testing input again
#define DEBOUNCE_MSEC (100)

static uint8_t was_on;	// stored state of LED, for detecting transition

static uint16_t min_pulse_usec=5;
// min pulse width (in  microseconds) for detecting a touch

void setup(void)
{
    was_on=0;
    pinMode(CAP_PIN,INPUT);
    pinMode(13, OUTPUT);
    
    // assuming that the touch sensor is not touched when resetting, 
    // find the maximum typical value for untouched sensor
    for (uint8_t i=0; i<10; i++)
    {   long pulse=pulseIn(CAP_PIN,LOW);
        if (pulse>min_pulse_usec)
	{    min_pulse_usec =pulse;
	}
    }
    min_pulse_usec += 2;	// add some room for noise
}

void loop(void)
{
    uint8_t on = pulseIn(CAP_PIN,LOW) >= min_pulse_usec;
    digitalWrite(13, on);
    if (on!=was_on)
    {   delay(DEBOUNCE_MSEC);
        was_on=on;       
    }
}


Filed under: Circuits course Tagged: Arduino, bioengineering, capacitive touch sensor, circuits, course design, op amp, sensors, teaching

Capacitive sensing with op amps

I’m not very happy with the lab exercise in Capacitive sensing.  The basic design questions are good:

  • What capacitance do we add by touching something?
  • What frequency should the oscillator run at without the touch?
  • What % change in frequency can we detect reliably? How will we do that detection?

but I’m not happy with my choice of an LM555 chip for the oscillator.  It is a fine choice for many purposes, and a good chip for students and hobbyists to learn about, but the Fairchild Semiconductor LM 555 data sheet does not do a good job of explaining how the chip works nor exactly what the logic function is for triggering the flip-flop.  As a result, students will probably end up just copying the astable circuit without really understanding it.

I think I would prefer to have them use an op-amp multi-vibrator circuit.  It can’t quite be modeled with only linear op amps, as it relies on clipping of the output to get nearly a square wave.

Op amp multivibrator. The first op amp is just to set up a virtual ground halfway between the power rails. The second op amp does the oscillating (at about 8.12 kHz for these components). Circuit drawn with CircuitLab, which is not capable of simulating it.

The op-amp multivibrator is a simple design.  When the output is high, C1 is charged until V_minus is higher than the positive input of the op amp (about 34.7% of the way from Vbias to Vout=Vdd).  Then the output goes low (taking about 6µsec, limited by the slew rate of the op amp), and the capacitor discharges until it is below the positive input (about 65.3% of the way from Vbias to Vout=0 with these values for R4 and R5). So Vminus swings from (1-0.6526) Vbias = 0.1737 Vdd to Vbias+0.6526(Vdd-Vbias)=0.8263Vdd.  The time it takes to charge or discharge should be about ,  where the time constant τ=R3 C1.  For the values of R4 and R5 here, the charge time should be 1.560 τ, and the period 3.119 τ. With the given values of R3 and C1, this should be a period of 102.9 µsec, or a frequency of 9.7 kHz.   I’m measuring 8.1 kHz, not 9.7 kHz, but I think that the discrepancy is due to the slew rate limitations (which add about 12 µsec to the period) and possibly stray capacitance.  With C1=47 nF, the frequency is 203.6 Hz, when the calculation says it should be 206.7 Hz, well within the accuracy of the components.

Connecting the foil-and-plastic-wrap sensor to Vminus adds a little stray capacitance, dropping the frequency to 8.01 kHz. Touching the sensor drops the frequency to 7.5 kHz–7.7 kHz, adding about 5 µsec–8.5 µsec to the period, consistent with adding about 50pF – 83 pF to C1.  This is a little smaller than the 163 pF that I estimated using the parallel-plate model in Capacitive sensing, but consistent with my measurements using the LM555 circuits.

I can get a much stronger effect if I remove C1 from the circuit, and use only stray capacitance.  The period drops to about 6.2 µsec (roughly 160 kHz), but (because of the slew rate limitations of the op amp) is not full scale and is essentially a triangle wave.  Touching the sensor reduces the frequency to about 35 kHz – 45 kHZ, an increase of 16 µsec – 22 µsec in period, consistent with an additional capacitance of  155 pF – 220 pF, which is about what was predicted by the parallel plate model. I’m a little reluctant to put this signal into an Arduino board, though, as the no-touch signal spends most of its time in the non-digital region between high and low, and only barely crosses the thresholds that would allow the ATMega328 chip to detect the signal.

One interesting idea would be to take advantage of the change in amplitude of the oscillation to make an all-analog touch detector.  I’m afraid that would not be very robust, though, as an increase in the period of only 12 µsec is enough to make the oscillation full scale.


Filed under: Circuits course Tagged: Arduino, bioengineering, capacitive touch sensor, circuits, course design, LM555, op amp, sensors, teaching

Capacitive sensing, part 2

The obvious next step with the capacitive sensor is to make the sensor actually control something.  This is not essential for the circuits class—for that class it is better to have the students viewing the waveform on the oscilloscope and seeing the frequency of the output vary  as the touch varies.  But I was curious about whether the various grounds (oscilloscope, USB cable, wall wart power supply) were making a difference to the capacitive sensing, so I wanted to redo the capacitive sensor to be a fully battery-based application, with no external ground connections.

To display whether the sensor had been touched or not, I turned on or off the LED on pin 13. I used the same software detection mechanism as in the previous post, counting the number of pulses it takes to get a total time for the signal being low. Touching my laptop (to reduce the resistance to ground) no longer makes a difference in the sensitivity of the switch, now that the battery ground is separated from the laptop ground.

// Capacitive sensor switch
// Mon Jul  9 06:05:54 PDT 2012 Kevin Karplus

// To use, connect the output of the LM555 oscillator to
// pin CAP_PIN on the Arduino.
// The code turns on the LED on pin 13 when a touch is sensed.

// The Arduino measures the number and width of LOW pulses on pin 2 until
//    the sum of the pulse width exceeds TOTAL_PULSE_USEC.
// The LED is turned on if the number of pulses is less than NO_TOUCH_NUM

#define CAP_PIN (2)

#define TOTAL_PULSE_USEC (100)	// total of pulse widths (in  microseconds) before reporting
#define NO_TOUCH_NUM (50)

void setup(void)
{
    pinMode(CAP_PIN,INPUT);
    pinMode(13, OUTPUT);
}

void loop(void)
{
    uint32_t pulse_sum=0;
    uint16_t num_pulses=0;
    while (pulse_sum<TOTAL_PULSE_USEC)
    {   pulse_sum += pulseIn(CAP_PIN,LOW);
        num_pulses++;
    }
    digitalWrite(13, (num_pulses<NO_TOUCH_NUM? HIGH:LOW));
}

I had to set the threshold a bit higher than I expected, indicating that the frequency shift was not as large without all the connections to ground, but the sensor still works with a moderately firm touch. With a light touch, the LED flickers on and off, indicating that the frequency shift is near the threshold. Raising NO_TOUCH_NUM too high has the LED always on. Even raising it from 50 to 55 makes the switch too sensitive—the LED turns on when my finger is still 5mm away from contact. Perhaps the ideal setting is 52, as that detects a light touch fairly reliably, but doesn’t fire until my finger is within about 1mm of the surface.

Note: it might make more sense to leave NO_TOUCH_NUM at 50 and adjust TOTAL_PULSE_USEC down to 96, since the larger number can be adjusted more finely.

If I wanted to avoid the flicker, I would debounce the detection.  I can’t use the Arduino Bounce library for this, as the signal that needs debouncing is in software, not on a pin.  It is a trivial matter to add a delay whenever the output changes, though:

// Capacitive sensor switch
// Mon Jul  9 06:44:33 PDT 2012 Kevin Karplus

// To use, connect the output of the LM555 oscillator to
// pin CAP_PIN on the Arduino.
// The code turns on the LED on pin 13 when a touch is sensed.

// The Arduino measures the number and width of LOW pulses on pin 2 until
//    the sum of the pulse width exceeds TOTAL_PULSE_USEC.
// The LED is turned on if the number of pulses is less than NO_TOUCH_NUM.

// pin that LM555 output connected to
#define CAP_PIN (2)

// total of pulse widths (in  microseconds) before reporting
#define TOTAL_PULSE_USEC (96)

// minimum number of pulses to indicate that sensor is not touched
#define NO_TOUCH_NUM (50)

// time (in milliseconds) to wait after a change in state before
// testing input again
#define DEBOUNCE_MSEC (100)

static uint8_t was_on;

void setup(void)
{
    was_on=0;
    pinMode(CAP_PIN,INPUT);
    pinMode(13, OUTPUT);
}

void loop(void)
{
    uint32_t pulse_sum=0;
    uint16_t num_pulses=0;
    while (pulse_sum<TOTAL_PULSE_USEC)
    {   pulse_sum += pulseIn(CAP_PIN,LOW);
        num_pulses++;
    }
    uint8_t on = num_pulses<NO_TOUCH_NUM? 1:0;
    digitalWrite(13, on);
    if (on!=was_on)
    {   delay(DEBOUNCE_MSEC);
        was_on=on;
    }
}

Debouncing does not completely eliminate multiple flashes. If I hold my finger very steady just touching the sensor or my whole hand flat about 1mm away, the LED will flash on and off about 5 times a second (the speed of the flashing is determined mainly by DEBOUNCE_MSEC).

Really good code would not require fixed NO_TOUCH_NUM and TOTAL_PULSE_USEC, but would learn what values are usual for off and on states and set the thresholds to separate them reliably.  I’ve not figured out a good way to do this as unsupervised learning. It would not be very difficult to have initial settings, gather averages for on and off states, then dynamically adjust the threshold, but I don’t know how stable such threshold setting would be. I suspect that it would end up rather unreliable, and highly dependent on good initial settings.


Filed under: Circuits course Tagged: Arduino, bioengineering, capacitive touch sensor, circuits, course design, LM555, sensors, teaching

Capacitive sensing

I decided that it was time to try a new circuits lab today.  Although I have the INA-126 instrumentation amplifier working (with a 220Ω gain resistor for a gain of about 370), and I did get some EKG stick-on electrodes, I don’t feel like trying to debug the EKG lab today.  I could do a little more with the instrumentation amplifier and the new function generator, adding the function generator output to the microphone output to see try to separate the differential gain from the common-mode gain, but I’m getting a bit tired of op-amp and instrumentation amp circuits.  I’ll try to come back to them later.

Other sensor ideas from What sensors for circuits class? that I have the parts for now include phototransistors, LEDs and IR emitters, and reflectance light sensors, but I don’t feel like playing with phototransistors today either.  That leaves one rather do-it-yourself sensor: a capacitance touch switch.  I was thinking of implementing this with LM555 timer chip as an oscillator, detecting capacitance increase as a change in the frequency of the oscillator.

Design questions include

  • What capacitance do we add by touching something?
  • What frequency should the oscillator run at without the touch?
  • What % change in frequency can we detect reliably? How will we do that detection?

Capacitance

Let’s do a first-principles calculation of capacitance of a touch, using a simple parallel-plate model.  Let’s say that the area of the touch, pressing lightly with a finger, is about 1cm^2.  We need to know the dielectric constant of the insulator and its thickness.  Let’s say we use a cheap plastic  wrap from the grocery store.  According to Wikipedia, common plastic wraps are about 0.5 mils (12.5 µm) thick and are now generally a low-density polyethylene (LDPE).  According to Bert Hickman (referring to sites that no longer exist), the relative dielectric constant for LDPE is 2.2, with a breakdown voltage of 3000v/mil (or 1500v for 0.5mil).  Of course, he also claims that the common wrap material is a mix of PVC and PVDC, which seems to be out of date information. The A to Z of Materials site for LDPE claims

Dielectric Strength (MV/m) 27
Dissipation Factor 1kHz 0.0003
Dielectric Constant  1kHz 2.3

That dielectric strength would be 337V at 12.5µm, which seems more reasonable than Bert Hickman’s numbers.

I also have 3M contractor’s plastic for masking large areas when painting. It claims to be 8.9 µm thick, but I can’t figure out what the material is (they just say “high density plastic”).  If it is HDPE (a possibility), the A to Z of Materials site for HDPE claims

Dielectric Strength (MV/m) 22
Dissipation Factor 1kHz 0.0005
Dielectric Constant  1kHz 2.3

which gives the same dielectric constant as LDPE, but the breakdown voltage would be about 195V at 8.9µm—still plenty for a touch sensor.

If I have 1 cm^2 (1E-4 m^2) area, 5 mil thickness (12.5E-6m), relative dielectric constant of 2.3, and ε0=8.8542E-12 F/m, I get a capacitance of 163pF for the touch.

Frequency

The LM555 can be set up as an astable oscillator:

LM555 astable oscillator circuit from the Fairchild Semiconductor LM 555 data sheet.

The data sheet gives the period of the oscillator as and the frequency as . If I want a slow oscillator, I’ll need to use a large resistance.  The largest resistance they show in the data sheet is RA+2RB=10MΩ, and I happen to have some 3.3MΩ resistors, so 9.9MΩ seems reasonable.  If I had no stray capacitance, 163pF and 9.9MΩ would give a period of 1.6msec (620Hz).  But, of course there will be substantial stray capacitance—probably much larger than the touch capacitance.  In any event, the increment to the period of the oscillator by adding the touch capacitance should be about 1.6msec, so we need to be able to detect that small a change in the period.  The percentage change will depend mainly on the stray capacitance.

One thing that is not clear from the LM555 data sheet is what value should be used for C2.  I suspect that it is just a bypass capacitor to reduce noise in the reference voltages used for the threshold, so a 4.7µF ceramic capacitor (of which I have several) should do fine.  Design notes I’ve seen on the web suggest that 0.1µF is plenty, though a bypass on the Vcc input of that amount is also recommended.

Experiment

I set up the circuit on the breadboard, with RA=RB=3.3MΩ, C1 being just the stray capacitance in the circuit, and C2 being a 4.7µF ceramic bypass capacitor. I also put a 4.7µF bypass capacitor between pins 1 and 8, as well as a 470µF electrolytic capacitor, to make sure that the power supply was clean.

The resulting oscillator has a period of about 0.2msec (4.4kHz), but it fluctuated a lot, so that I could not get a clean trace on my oscilloscope. Touching the insulted sensor pad (made from Al foil and Glad Cling Wrap) caused the period to increase enormously, but to a pulse train of 3 pulses that repeated at 60Hz.  I believe that what I was mainly doing was coupling in a 60Hz noise signal, rather than detecting a change in the capacitance to ground.

I could decrease the sensitivity of the circuit to noise by reducing the resistances and adding some more capacitance to C1. Adding 1nF cleans up the signal, but doesn’t eliminate the problem.  I get 107±1Hz without a touch, and 60Hz with a touch.  I’m still mainly coupling in 60Hz noise!  I’d have to reduce the impedance to reduce the 60Hz coupling, reducing RA and RB.

Leaving in the 1nF capacitor and reducing RA and RB to 100kΩ results in a non-touch frequency of 4.05kHz and a touch frequency of 3.6kHz.  This is about a 30µsec difference in period, consistent with an 150pF change in capacitance. But this frequency change seems to be almost independent of the area of contact, which is not consistent with a parallel plate model.  The lower frequency still seems to be modulated by a 60Hz hum.

Removing the 1nF capacitor, but leaving the 100kΩ resistors, I get a no-touch frequency of 140kHz–156kHz (depending on how close my arm comes to the sensor) and a touch frequency around 45kHz–50kHz, a 15µsec difference in the period. A firm press with all my fingers depresses the frequency further, down to about 20kHz. Touching my laptop (reducing my resistance to ground) decreases the frequency further—pressing with my palm and touching the laptop gets the frequency own to about 13kHz.

Here is the complete layout for the capacitive touch sensor, showing (clockwise) the aluminum foil wrapped in Glad Cling Wrap (except for the folded over part where the alligator clip is attached, the breadboard with the LM555 chip, and the Arduino board.

I wouldn’t want to use the interrupt-driven timer code to measure this frequency, but a simple busy-wait loop that times the period could work, or I could add a counter to divide the frequency down (and average out many clock cycles).  But this is supposed to be a circuits class, not a digital design class, so adding a counter is probably not appropriate for the lab.  Perhaps a better approach is to measure the duration of the low part of the pulse, which should be about 1/3 of the total period, using the Arduino pulseIn function.  Looking on the scope, the low part of the pulse seems to be closer on 1/6th of the total period than to 1/3 at the high frequency, though the ratios are more reasonable at the low frequency.  I suspect that there are stray capacitance within the LM555 that account for some of the pulse shape error.

By averaging over 500 pulses, I see a switch from 1.15±0.03 µsec for the low pulse in the no-touch configuration to 5.4±0.3µsec for a firm touch and 2.8±0.2µsec for a light touch (and up to 220µsec for a full-palm touch while touching my laptop). Single pulse measurements may be a bit unreliable at those speeds, since pulseIn only has 1µsec resolution, but adding 500 pulses doesn’t take much time, unless the capacitance is very high. Putting the 1nF capacitor back in the circuit makes the low time look more like 1/3 of the period.  The pulse widths are about 78.4±0.05µsec for no-touch and 80µsec–85µsec for a touch.  Those are long enough to be reliably detected with even a single pulseIn call, but the difference is rather small, so setting a fixed threshold would be a bit risky.

An alternative approach to averaging 100s of pulse widths is to collect pulses until the total pulse width exceeds 200µsec and report the number of pulses collected.  That mechanism results in an easily detected change in counts (from over 150 to under 60) and a response time of about 2–5msec (most of which is probably in the serial communication).  A detection threshold would have to be set for each different sensor plate the circuit is connected to, but that is pretty straightforward.

Here is the code I used for detecting sensor touches with summed pulse widths (click to expand):

// Capacitive sensor timer
// Sun Jul  8 17:59:49 PDT 2012 Kevin Karplus
//
// License: CC-BY-NC http://creativecommons.org/licenses/by-nc/3.0/
//
// To use, connect the output of the LM555 oscillator to
// digital pin 2 on the Arduino.
// On initialization, the Arduino will print "Arduino ready." to serial.
// The Arduino measures the number and width of LOW pulses on pin 2 until
//    the sum of the pulse width exceeds TOTAL_PULSE_TIME.
// It then reports 3 numbers to the serial line:
// The first is the time since the start, in microseconds.
// The second is the number of pulses measured.
// The third is the average duration of the pulses.
// Serial baudrate is 115200.
// The start time may be reset by sending the character 'R'.

#define TOTAL_PULSE_TIME (200)	// total of pulse widths (in  microseconds) before reporting

unsigned long first_time;   // what was the time for the first tick since reset?
// All times are in microseconds.

// do_reset() empties the queue and sents the count to 0
void do_reset(void)
{
    noInterrupts();     // don't take interrupts in the middle of resetting
    first_time=micros();
    // let the user know that the Arduino is ready
    Serial.print(F("\nArduino ready.\n"));
    interrupts();
}

// interrupt handler for data becoming available on the serial input
// Reset if an R is received
void serialEvent(void)
{
    if (Serial.read() == 'R')
    {
        do_reset();
    }
}

void setup(void)
{
    Serial.begin(115200);       // use the fastest serial connection available
    do_reset();
    pinMode(2,INPUT);
}

void loop(void)
{   // keep trying to print out what is in the queue.
    uint32_t pulse_sum=0;
    uint16_t num_pulses=0;
    while (pulse_sum<TOTAL_PULSE_TIME)
    {    pulse_sum += pulseIn(2,LOW);
        num_pulses++;
    }
    uint32_t datum=micros();
    Serial.print(datum - first_time); // time since start (usec)
    Serial.print("\t");
    Serial.print(num_pulses); // number of pulses
    Serial.print("\t");
    Serial.println(pulse_sum*(1.0/num_pulses), 2); // avg pulse duration
}


Filed under: Circuits course Tagged: Arduino, bioengineering, capacitive touch sensor, circuits, course design, LM555, sensors, teaching

Temperature lab, part 3: voltage divider

In Temperature lab, part2, I carefully measured the resistance vs. temperature curve for the Vishay BC Components NTCLE413E2103F520L thermistor, finding that either my thermometer was badly miscalibrated, or the manufacturer’s data sheet was misleading.  I got a resistance of 9.7kΩ (not 10kΩ±1%) at 25° C and a B-value of 3174°K, not 3435°K±1%.  A big part of the discrepancy is that I calibrated over a different temperature range, and the measured values deviated most from the manufacturer’s spec at low temperatures.

Actually, the manufacturer’s data sheet is not as bad as all that.  They give specs for the ratio of the resistance at various temperatures to the resistance at 25° C, and their numbers do not fall along a simple curve.  The report the B-value as a 2-point fit for T=25° C and T=85° C, but they also report resistance values every 5° C from –40° C to 105° C.  One can compute the B-value for any pair:

But even if I use their calibration data down to 0° C, I don’t get as small a B-value as I get from my measurements. My calibration curve does not fit their spec, even if I look at the table, rather than the simple B-value model (though the table is closer to my measurements, it doesn’t match).

How big a difference would if make if I used their curve rather than mine?  At R=6685Ω, we get the same temperature either way (96.446° F).  At the resistance they claim for 0° C (27348Ω), their B-value model would give 33.90° F and mine would give 29.37° F.  At the resistance I measured for 0° C (25.5kΩ), their model would give 36.67° F, while mine gives 32.32° F (which is closer than the measurement error I had on temperatures).  So it looks like relying blindly on their B-value model introduces an error of over 4° F at low temperature, but in a digital thermometer for human body temperature, one would get nearly the same result with either calibration.

Voltage divider

The second part of the lab was to use the calibration curve to design a circuit to convert the resistance variation into a voltage variation that is nearly linear with temperature, at least over a small range.  The simplest circuit to convert a resistance to a voltage is a voltage divider, which just requires a voltage source and another resistor.

A simple voltage divider for converting the thermistor resistance to a voltage. Because I want the output voltage to increase with temperature, but the resistance R(T) decreases with temperature, I put the thermistor on the top branch and fixed resistance on the lower branch.
Circuit drawn with the Circuit Lab editor.

The formula for the output voltage is simple: , where we are approximating for temperature T in Kelvin. We’d like the voltage to be as linear as possible, which means we want the second derivative of Vout with respect to T to be zero. Obviously, we can’t do that for all values of T, but we might be able to do it for a particular value of T, and to have a small second derivative in that neighborhood.

We can take the derivatives by hand (or use a tool like Maple or Mathematica):


The second derivative is 0 if , that is if .

We can use this formula to set the value for any temperature, for example, if we want linearity around 98.6° F (310.15° K), we can set the series resistor to 4323.64Ω.

Expected voltage curve using a voltage divider with series resistor optimized for 98.6° F. Note that the curve is fairly linear from about 70° F to about 130° F (where the red non-linear curve and the green linear approximation at 98.6° F are quite close.

Of course, commercially available resistors don’t come in values like 4323.64Ω, so in doing a design one has to pick an available resistor, using the EIA table of standard resistor values.  A 4.7kΩ resistor looks pretty close, which would be color code yellow-violet-red.  Too bad that I don’t have one.  I do have a 5.1kΩ resistor, which would be optimal for linearizing at 90.06° F.  We should, of course, ask students to do the resistor selection for a different temperature than the one we use in an example, and they should be using their own B-value.

Testing the voltage divider

I set up the voltage divider on a breadboard.  Because I knew my wall wart had a huge ripple, I added a low-pass RC filter consisting of a 100Ω resistor and a 470µF electrolytic capacitor.  This slightly complicates the analysis of the voltage output, since the Vdd voltage is itself dependent on a voltage divider.

Low-pass filter to clean up the output of the wall wart. With the low-pass filter in place, we can model the power supply as a 5.166V source and 100Ω series resistor.

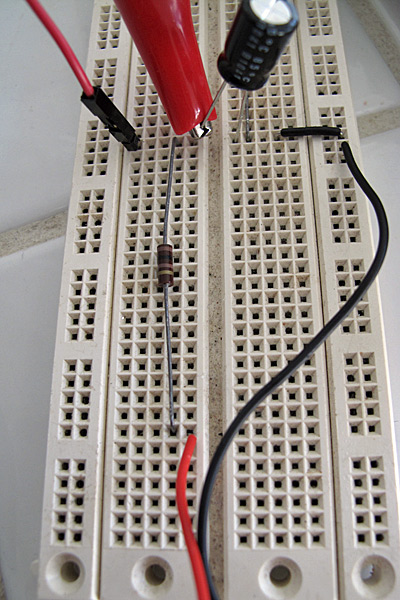
Here is what the low-pass filter looks like on the breadboard. The red and black wires from the bottom come from the connector to the wall wart. The 100Ω resistor runs vertically up the center, and the electrolytic capacitor connects across to the ground. The red clip lead is from the multimeter and is set up for measuring the voltage at the output of the filter.

Here is the full breadboard, showing the RC filter, the series resistor, the leads to the thermistor (the red and yellow lines with the crimp-on connectors), and the clip leads to the multimeter (the red and black alligator clips). I’ve found it very handy to have a number of double-sided header pins to make easy connection points on the breadboard for clip leads.

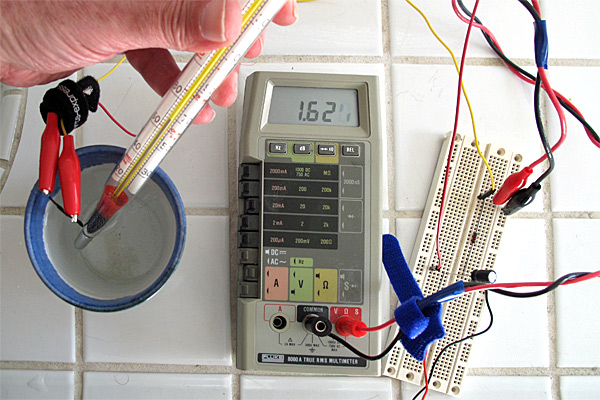
Here is the setup used for testing. The thermistor and thermometer are in the ceramic-cup water bath, with the thermometer held to keep the bulb in contact with the thermistor. You can see that the least-significant digit of the LCD display is a bit hard to read—applying some pressure to the display often makes it readable. Clip leads are essential to doing this experiment—holding the multimeter probes to test points would be a major hassle.

I only made 21 measurements of voltage, since I was not going to be fitting a model to the data, but just using the model I fit from the resistance measurements.

Plot of measured and theoretical voltage vs. temperature for the thermistor. The non-linear theoretical curve seems to be a pretty good fit (though it was not fit on this data, but on the previous series of resistance measurements).

The range of the voltages with the series resistor (from about 0.85v at freezing to 4.15v at boiling) is fairly reasonable for direct conversion to digital for the Arduino 10-bit ADC. In the middle of the range, the slope is about 0.0233 V/°F, which would give a resolution of about 0.2°F for Arduino readings.  (Of course, with the Arduino, we would not need the low-pass filter, and Vdd would be a well-regulated 5v, so this calibration curve would have to be redone.)  Even if we use the computational power of the Arduino to correct the non-linearity of the voltage curve, it is still useful to select the series resistor for the temperature we are most interested in, since that point gets the largest slope and hence the highest temperature resolution for fixed-size steps in voltage quantization.

Series-parallel

A lot of thermistor circuits on the web have a resistor in parallel with the thermistor, as well as the one in series. I wondered what the effect of this extra resistor was.

Circuit with resistor in parallel with the thermistor, as well as in series.

I tried analyzing this circuit also, using the same brute-force approach of computing the second derivative of the voltage and setting it to zero.  I got a result that surprised me initially:  the second derivative is zero if , where is the resistance one would get for putting the series and parallel resistors in parallel. This is exactly the same condition as before, but with replacing the series resistor .

After I thought about this for a while, I realized that I should have been able to get there directly. If you think of the circuit as connecting the thermistor to a voltage divider consisting of R2 and R1, then you can replace the ground and that voltage divider by the Thévenin equivalent, which would be a voltage source with voltage and a series resistor consisting of  R1 and R2 in parallel: .  The only reason to put in a parallel resistor would be to restrict the voltage range (which might be useful if the output were to be amplified, but is not useful if the output is going directly into an analog-to-digital converter whose full-scale range is 0 to Vdd).


Filed under: Circuits course Tagged: Arduino, bioengineering, circuits, course design, teaching, temperature measurement, Thévenin equivalent, thermistor, voltage divider

Temperature lab, part2

The thermistors that I ordered (see More musings on circuits course: temperature lab and Buying parts for circuits course) arrived today, about 2.1 days after I ordered them.  So I’ll try playing with them today, and see whether I can do the lab I’m thinking of for the students.

My son is still working on the Arduino data logger.  The Arduino code has been done for a while, but he’s been working on the Python front end.  He’s decided to do two front ends: a minimal one with no GUI and a fancy one using PyGUI.  He’s run into some problems (like PyGUI not supporting autoscrolling in TextEditor components), but everything seems to be solvable at this point.  He had a GUI interface working, but decided he needed to refactor his code to have a proper API for the datalogger, so that the user interface and the datalogger core code were as independent as possible with a documented interface between them—he’s teaching himself a lot about software engineering for this project, which is the first one for which he has had an external client.

The action plan for testing out a temperature measurement lab that I posted in More musings on circuits course: temperature lab was

  • Get some thermistors and some thermometer probe sheaths and see if I can make adequate temporary waterproofing for pennies per student.  I’ll probably have to solder on wires to lengthen the leads.
  • Try calibrating thermistors using a multimeter, cups of hot and cold water, and an accurate thermometer.
  • Try reading the thermistor using a voltage divider and the Arduino ADC.  Plot the temperature and Arduino reading over a wide temperature range (say, as a cup of boiling water cools).
  • Try linearizing the thermistor readings  using a parallel resistor and voltage divider.
  • Try designing an amplifier to read the thermistor with much lower current through it (and so less self-heating).

I’ve got three types of thermistors (all 10kΩ nominal resistance at 25° C), none of which are intended for immersion:

  • Vishay BC Components NTCLE100E3103JB0 a very cheap (23.5¢ each in quantities of 10) with B-value 3977°K).  There is high variation in the resistance (±5%), but low variation in the B-value (±0.75%).  These are glass-bead thermistors with 2cm uninsulated leads, so will need waterproofing. I bought 10 of these, but am hoping that I don’t need them.
  • Vishay BC Components NTCLE413E2103F520L (34.9¢ each in quantities of 10) has 4cm leads and is epoxy coated, but with the warning “Not intended for fluid immersed applications or continuous contact with water.”  It has B-value 3435°K, both resistance and B-value ±1%.  I plan to find out today if it is waterproof enough for the relatively short duration of the labs. I bought 10 of these also, and have the highest hopes for these being the ones we use in the lab.
  • Murata Electronics North America NXFT15XH103FA2B100 (66¢ each in quantities of 10) with B-value 3431°K, both resistance and B-value ±1%. The 9.5cm leads make these likely to be the easiest to use with thermometer probe covers, but they are more expensive.  I bought 4 @ 87¢, so as to keep the cost per thermistor type below $3.50. Note: the specs give different B-values depending which pair of temperatures used—I’ll have to look to see if they have specs for higher-order models of the resistance as a function of temperature.

The setup at 110°F, showing 4.60kΩ as the resistance.

I’ll try the epoxy-coated ones with the 4cm leads first. The first step is calibrating one with an ohmmeter. I used clip leads to connect a cheap multimeter to the thermistor, then dunked the thermistor in a glass of warm water with a thermometer (note: we’ll need to get some thermometers for this lab). The thermometer I used is a pasteurizing thermometer that I’ve had for years—it is, unfortunately, calibrated in Fahrenheit, not Celsius. Of course, we ideally want temperature in Kelvin.

I put a table of the measurements on a separate page, to avoid cluttering up the post with a table of 28 measurements.

I don’t expect many of the students will have the patience to make 28 measurements, but if we provide some different hot water sources (water boiled in a teakettle and ice water in a thermos), they should be able to make 10 measurements across a wide range of temperatures. I stopped at 28 measurements, because the alligator clip broke the wire and I didn’t feel like stripping more of the insulation and reconnecting.

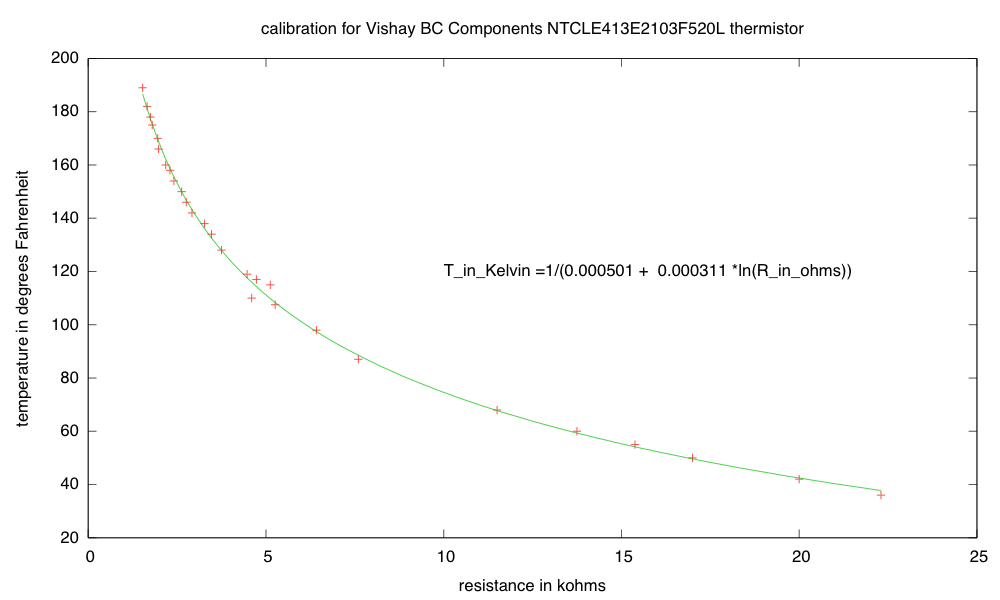
I tried to fit the Steinhart-Hart equation to the data, where R is the resistance in Ω and T is the temperature in degrees Kelvin. But gnuplot got as good a fit using just A and B as using the third order fit, with providing an excellent fit.

Fitting the first two terms of the Steinhart-Hart model for thermistor behavior.


Simple Arrhenius fit for the data. When I fit the equation , which is the equation most often used in thermistor specs, I get A=0.24Ω and B=3157°K, which is not that close to the spec (10kΩ @ 25°C, B=3435±35°K, so A=0.0992Ω). Note that the spec curve fits the data quite well for warm temperatures, but deviates badly for cold ones.

There could be systematic problems with either my temperature readings or my resistance readings. The multimeter is more suspect than the thermometer, but the readings would have to be off by 500Ω to get that sort of error in the B-value. The numbers look particularly bad around 110°F. I think I need to get some new batteries for my other other cheap multimeter (which I think is a bit better) and see if it gives more reasonable results.

Wait a minute! I have an old Fluke 8060A multimeter (between 26 and 30 years old) that has a bit of a wonky LCD display, and a blown fuse on the 10A input, but is otherwise still probably my most accurate meter. If its batteries aren’t dead, I may be able to use it to get better measurements.

I tried measuring some known resistors, to see if the meters are way off. I tried an 11.8kΩ ±1% resistor: Fluke meter says 11.77Ω and the suspect multimeter says 11.67kΩ, while for a 732Ω±1% resistor, the Fluke meter says 731.1Ω, while the suspect meter says 718Ω. So the suspect meter appears to be reading 1–2% low, while the Fluke meter is within the accuracy of the resistors. So I boiled up some more water and tried another series of readings (the 63 readings are in a table on a separate page to avoid clutter here.)

Note that there are three runs of data: cooling down from boiling, cooling down from hot tap water, and cooling with ice from room temperature. I found it easiest to do this work on the counter in the bathroom, where I could easily adjust the temperature by pouring out some water and adding more hot or cold water. I was also very careful to make sure that the bulb of the thermometer was in contact with the thermistor while making the measurement, so that they were as nearly the same temperature as I could make them.

Let’s see what sort of fit we can get with this data.

The second data set, with 63 data points, is much cleaner than the first data set, and is well fit by a simple 2-parameter model (leaving out the third term of the Steinhart-Hart equation. Because it is hard to read the thermometer to better than 0.5°F, the fit is really quite good.

The data once again does not match the specified B-value of 3435°K±1%, but B=3174°K, though the curves are quite close for warmer temperatures.

The data sheet reports the 3435°K B-value as a B25/85 measurement, that is, it is based on values at 25°C (77°F) and 85°C (185°F).  If we just fit over that range, we can get the B-value up to 3236°K, which is still a long way short of the specified B-value.

Since I now trust that the resistance measurements are fairly good, the large error in the B-value has to be either from the thermometer or the thermistor. Because I don’t have a more accurate thermometer, and I’m not inclined to get one, I’m a bit stuck at this point in determining whether the thermistor meets the spec or not.

Doing a large number of measurements like this took far too long for the first part of a lab.  A lot of the time was spent waiting for the temperature of the water bath to change (or trying to make change by adding water or ice). We’ll probably have to ask for just 5 or 6 values, perhaps providing them with 5 or 6 water baths in thermoses that they can run their thermistors through one after another, to get the measurements rapidly. We will need some decent thermometers, capable of reading to ±0.2°C, if they aren’t too expensive.

Tomorrow I’ll try doing the electronics part of the lab, adding series and parallel resistors and measuring the voltage with the Arduino.


Filed under: Circuits course Tagged: Arduino, bioengineering, circuits, course design, teaching, temperature measurement, thermistor

Buying parts for circuits course

I’m going to need some parts to play with for the circuits course.  While I probably could get the parts I need at work from the Baskin Engineering Lab Support (BELS) staff, it would probably involve a bit of hassle, as there isn’t even a course number for the course yet, and so they’d have a difficult time figuring out which department to charge for the 30¢ and 60¢ parts—the cost in staff time (and my time) would be ridiculous.  So I decided to buy my own parts with my own money from Digikey.  My experience with them in the past is that in-stock parts generally get delivered by US mail within 2 days of ordering (it helps that they are not far away).

One experience we don’t give the students (at least, not until the senior design project) is trying to figure out what parts to buy.  It can be an overwhelming task—DigiKey has in stock 10,917 chips that come up in response to a search for op amps. We can reduce that to 1,249 if we restrict ourselves to through-hole rather than surface-mount parts. Adding a request for rail-to-rail outputs reduces that number to 314.  Sorting by price and looking through those under $1 shows many from Microchip Technology, each with slightly different specs.  I don’t see any way that a student in a beginning circuits class could make sense of most of the specs.

Thermistors are almost as bad, as there are a lot of specs for them also, and the price range is huge.  You have to know that you want NTC (negative thermal coefficient) devices, which gets you down to 1,369 thermistor types.  Eliminating surface mount parts reduces the number to 479, ranging in price from 23.5¢ each to $20 each.

I’ve decided to play with three different thermistors:

  • Vishay BC Components NTCLE100E3103JB0 a very cheap (23.5¢ each in quantities of 10) 10kΩ thermistor with B-value 3977K).  There is high variation in the resistance (±5%), but low variation in the B-value (±0.75%).  These are glass-bead thermistors with short leads and will need some sort of waterproofing for the labs.
  • The epoxy-coated Vishay BC Components NTCLE413E2103F520L has 50mm leads and is epoxy coated, but with the warning “Not intended for fluid immersed applications or continuous contact with water.”  It is a 10kΩ thermistor with B-value 3435K, both ±1%, and costs 34.9¢ each in quantities of 10. It may be waterproof enough for the relatively short duration of the labs, and the 2″ leads may make it easier to use with disposable thermometer covers from the drugstore.
  • Murata Electronics North America NXFT15XH103FA2B100 a 10kΩ thermistor with B-value 3431K, with low resistance variation (±1%) and moderate B-value variation (±1%).  Note: the specs give different B-values depending which pair of temperatures used—I’ll have to look to see if they have specs for higher-order models of the resistance as a function of temperature. Although these thermistors cost more (66¢ each in quantities of 10), they have 100mm insulated, flexible leads, which should be long enough that we use these in a coffee-cup water bath, though they come with the warning not to use them in wet or humid locations, nor “Places with salt water, oils, chemical liquids or organic solvents”.  The long flexible leads may make this one the easiest to use with disposable thermometer covers.

It looks like I’d have to go to $2–$4 per part for thermistor probes with a brass, copper, or plastic sheath, and even then the manufacturers don’t say that they are waterproof.

I also decided to get myself some op-amp chips to play with, since we will certainly be assigning some op-amp labs. Because I don’t have a bench power supply, I want to use a single power supply, like a 5v wall wart (or the 5v supply for the Arduino).  I also want a DIP package, so that I can use the op amp on a breadboard.  I looked for cheap op amps on Digikey, and the best choice I found was a Microchip Technology MCP6002-I/P (33¢ each in quantities of 10) for a dual op amp with rail-to-rail output.  It is a bit slow (1MHz gain-bandwidth product, 0.6V/µsec slew rate), but has a low input bias current (1pA) and will run on a single power supply anywhere from 1.8V to 6V, so should be easy to use with batteries or the Arduino power supply.

I will have to be careful not to blow up the chips with my function generator, though, as I believe it has a 10V peak-to-peak output.  Maybe I won’t have to worry about it—I just tried to turn on my function generator to check the output voltage, and it won’t turn on.  The fuse looks ok, but I don’t even get a power-on light, much less any signal at the output.  I don’t know whether I want to try debugging it or not, given that I don’t even have a manual for it, much less a schematic.  It worked fine the last time I turned it on, so I’ve no idea what the problem is.  I suppose I should have expected it, buying cheap, old equipment on e-bay, but I didn’t expect the function generator to fail after I had checked that it was working.  It will be harder for me to develop a lab that uses a function generator, though, if I don’t have a functional one to test the lab with.  I wonder whether it is better to try to fix the one I have or get another one.

The students will have Agilent 33120A Function/Arbitrary Waveform Generators to work with, which are very nice instruments, but out of my price range ($1300 refurbished on e-bay, $2200 MSRP).  I could get a cheap Victor VC2002 for about $130, which is about as good a price as the used stuff on e-bay.


Filed under: Circuits course Tagged: Arduino, bioengineering, circuits, course design, function generator, op amp, teaching, temperature measurement, thermistor

More musings on circuits course: temperature lab

I’ve decided to do a lot of my musing about the course design on my blog, so that others could contribute to the course design (or at least participate vicariously).  I think that having an open log of our thinking on the course design will be useful to grad students or new faculty who are having to do their own course designs, to show how us old farts do it (whether they wish to copy our methods or avoid using them).

The relevant posts so far are

Changing teaching plans
More on electronics course design
Yet another project idea
Another way to think about course design

I’ve got my son working on Arduino software to act as a data logger, so that students can have an easy-to-use tool that requires no programming, but which is easily modified if they want to do their own programming.  He has Arduino code for alpha testing already, and I think he’ll have a user interface ready for beta testing by the end of the week, but he’ll only have tested it on a Mac—we’ll need to get him access to a Windows machine to do testing there, because there are some operating system dependencies in talking to USB devices like the Arduino from a Python program. He’s been consulting with me on desired specs for the data logger, but doing all the coding himself. It is good practice for him both in interrupt handling and in user-interface design. He’s also having to think about portability for the first time, as the data logger has to run on Windows and Mac OS X (I think that Linux users should have no trouble with the version that works on Mac OS X, but we probably won’t be testing it). He’ll have to write user documentation and installation instructions also. Some of the packages he likes to use (like PyGUI) are enough of a pain to install that he’ll probably provide a stripped-down interface without a GUI for those who want to do minimal installation (Arduino software, Python, and PySerial are only essentials).

The first lab I’ve been thinking about is for temperature measurements. For the small temperature ranges normally needed in biosensor applications, the sensitivity, low thermal mass, and low cost of thermistors make them probably the best approach, and I think that they are what are used in the cheap digital oral thermometers sold in drug stores.  I wonder what techniques the manufacturers use to get medically acceptable calibration for those devices.

I’ve been thinking about the thermistor lab—it seems like we could do that in stages: first just reading resistance with a meter, then adding a series resistor to make a voltage output, then adding a parallel resistor to try to linearize the exponential curve a bit, finally adding larger series resistors and an amplifier to avoid self-heating currents through the thermistor and to allow nearly the full range of the ADC to be used.  This series of lab exercises could be spread out over the quarter, as students learn more about circuits.

For them to calibrate the thermistor, we could use hot and cold water baths, if the thermistor was in a waterproof package. From what I can see, that raises the price of a thermistor with leads from about 25¢ (for something like the NTCLE100E3333JB0 by Vishay BC Components) to $1.55 (for USP10982 from US Sensor) or $3 (for USP10973RA from US Sensor).  [Prices from DigiKey 10-unit price.]

I think that having the students do their own waterproofing is probably not a good idea.  Potting components gets to be a mess, and adding a large blob around the thermistor will slow its response time a lot.  I wonder whether using 5¢ disposable thermometer probe covers would work, or whether they tear too easily.  I probably need to look at some at the drug store, to see whether there is thicker one on the market that the cheap thermistors would fit into.

If waterproofing a cheap thermistor turns out to be too difficult, we need to think about whether to use the more expensive parts or work out some cheap, measurable temperature sources that are not wet.  We could make something like is used in PCR machines, with a couple of blocks of aluminum and a Peltier device, but I don’t think that the price is worth it—better to use the sort-of waterproof probes, a cup of water, and a thermometer.

I’ve noticed that for some applications, people are choosing voltage-output temperature sensors that rely on the thermal
coefficient of a transistor, rather than on a thermistor, like the MCP9700-E/TO from Microchip Technology (25 cents).  They have a fairly linear 10mv/degree C output, but their absolute accuracy is even worse than thermistors. These may be a better choice than thermistors in many applications, but would not provide the same teaching opportunities for a circuits class.

Using a thin-film platinum resistor temperature sensor (RTD) like the US Sensor PPG102C1RD would allow more accurate temperature measurement without calibration. With calibration, RTDs can be the most precise electronic temperature sensors, though I don’t know if the high precision is available in thin-film resistors, or only in the more expensive wire-wound ones. I suspect that repeatability from part to part is higher in the wire-wound RTDs, but that the thermal coefficients are the same, so that calibrating at one temperature should give about equal accuracy either way.

The naturally linear response of RTDs (100Ω at 0°C and 138.5Ω at 100°C in a very straight line) does not lend itself to as much circuit design as thermistors. On second thought, converting the 3850 ppm/°C resistance change into a voltage range readable by the Arduino ADC is not a bad circuit exercise, particularly if self-heating is to be avoided, though it is not as difficult as flattening the highly nonlinear response of a thermistor.  The biggest problem with RTDs is their price: at over $10 for a bare sensor they may be too expensive for class use.

Another possible temperature sensor is a thermocouple, which generates a voltage based on the temperature difference of two electrically connected junctions of dissimilar metals. One article in the engineering toolbox claims that thermocouples are cheap and RTDs expensive, and I think that is true if you are looking for high-temperature devices (like thermocouples for detecting pilot lights in furnaces), but not so true if you are looking for careful measurement in corrosive wet materials (like most biosensing applications). See Choosing and using a temperature sensor for more info comparing RTDs and thermocouples. Thermocouples have relatively low precision and sensitivity, and they measure only the difference in temperature between two points, and so are probably not very interesting for biosensing.

Action plan for testing out a temperature measurement lab:

  • Get some thermistors and some thermometer probe sheaths and see if I can make adequate temporary waterproofing for pennies per student.  I’ll probably have to solder on wires to lengthen the leads.
  • Try calibrating thermistors using a multimeter, cups of hot and cold water, and an accurate thermometer.
  • Try reading the thermistor using a voltage divider and the Arduino ADC.  Plot the temperature and Arduino reading over a wide temperature range (say, as a cup of boiling water cools).
  • Try linearizing the thermistor readings  using a parallel resistor and voltage divider.
  • Try designing an amplifier to read the thermistor with much lower current through it (and so less self-heating).


Filed under: Uncategorized Tagged: Arduino, bioengineering, circuits, course design, teaching, temperature measurement, thermistor

Another way to think about course design

Continuing the series about designing an applied electronic circuits course for our bioengineering majors (with more project ideas and another project idea), I want to talk about another lab-oriented view of what we want the course to teach—what lab skills they should have by the end of the course. Eventually, I’ll get around to textbook-concept view of the course, but I’m trying to stay away from that for a while, since the course we are trying to replace was faulted for being far too theoretical.  I want to start with the practical goals first, and work out form there what are the most important theory topics and what order they should go in.

Again, this is all very preliminary brainstorming—I have to talk with my co-instructor about what lab skills are feasible to teach in the class, which ones he sees as essential, and which are beyond the scope of the class.  Here is a tentative list of technician-level skills that every engineer should have:

  • Reading voltage, current, and resistance with a multimeter.
  • Using an oscilloscope to view time-varying signals:
    • Matching scope probe to input of scope.
    • Adjusting time-base.
    • Adjusting voltage scale.
    • Using triggering.
    • Reading approximate frequency from display.
    • Measuring time (either pulse width or time between edges on different channels)
  • Using a bench power supply.
  • Using a signal generator to generate sine waves and square waves.  Hmm, only the salinity conductance meter uses an AC signal so far—I may have to think of some other project-like labs that need the signal generator.  Perhaps we should have them do some capacitance measurements with a bridge circuit before building a capacitance touch sensor.
  • Using a microprocessor with A/D conversion to record data from sensors.
  • Handling ICs without frying them through static electricity.
  • Using a breadboard to prototype circuits.
  • Soldering through-hole components to a PC board.  (I think that surface-mount components are beyond the scope of the class, and freeform soldering without a board is too “arty” for an engineering class.)

There are probably a lot more skills to add to this list, which I haven’t thought about yet, and details within these skills that I’ve not thought about.  Luckily, my co-instructor has been teaching beginning students how to use electronic lab equipment for over 15 years, so I’m sure he knows what needs to be covered.

The bigger problem here is motivating students to want to develop these skills quickly—the EE and computer engineering students see the skills as directly related to their chosen profession, but the bioengineers will need to know why anyone would care about resistance, voltage, or current.  Getting a simple biosensor in right from the beginning would probably help.  I wonder if we should start with a thermistor lab for resistance, voltage, and current measurement.  How soon can we cover voltage dividers, so that they can design a resistance-to-voltage converter for interfacing to the ADC on an Arduino? Can we do that in the first lab?


Filed under: Uncategorized Tagged: Arduino, bioengineering, circuits, course design, teaching

Yet another project idea

I wrote earlier this week about an applied electronic circuits course for our bioengineering majors  and added some more project ideas in another post.  This weekend, while in southern California for my niece’s wedding, I was given another idea for a project by my sister: a pulse oximeter.

I knew that a pulse oximeter worked by looking at ratios of two different wavelengths of light shining through a finger or earlobe, which have different absorption by oxyhemoglobin and deoxyhemoglobin, but I had never thought about the details.  The first thing that concerned me was how a single ratio of two light intensities could be used—there must be huge variations in how much absorption there is that have nothing to do with oxygenation of hemoglobin.  Rather than puzzle through this on my own, I looked up the Wikipedia article on pulse oximetry.

It turns out that different techniques have been used over the decades.  Some of the early methods used more than two wavelengths of light including some that did not distinguish between the two states of the hemoglobin, in an attempt to quantify the total amount of hemoglobin as well as the ratio of oxy- to deoxy-.  The modern approach, though, is much simpler and more elegant.  The ratio measurements are made repeatedly, and only the fluctuating part of the readings is used.  The arterial blood flow shows a strong pulse signal (at around 0.5–3 Hz), while contaminating signals (hemoglobin in veins, absorption due to tissue other than hemoglobin, fingernail polish, …) are constant. By ignoring the DC signal and using only the fluctuating signal, the oxygen ratios are fairly easily measured.  Note that a pulse is essential to this measurement—continuous flow would not work—hence the name “pulse oximetry”.

There is at least one homebrew pulse oximeter on the web (like this one done by some Polish students and described in Polish, with a Google translation).  As far as I can tell, they used a PWM output from the microprocessor to provide signals alternately to the two LEDs, and to demultiplex the signals from the sensor and do separate analog filtering of the two signals.  It would probably make more sense to reduce the sampling rate to about 100Hz and do all the processing digitally. One thing they did that might be a bit trickier on the Arduino was to adjust the current to the LEDs to keep the DC signal level roughly constant, despite differences in the thickness and opacity of the fingers they were shining the light through.  The Arduino provides PWM outputs, but not real digital-to-analog channels.

They also do not seem to have thought about how to calibrate the device, which could be a problem for our lab also. Since commercial pulse oximeters only cost about $30 these days, we could simply have a couple in the lab for students to compare their results to, making a calibration chart of their reading vs the commercial reading.  (The hard part would be finding variation in oxygenation, since every one in the lab will likely be in the normal range of 95–99% oxygenated.)

The pulse oximeter would be a nice step up from the simple one-channel pulse sensor.  Unfortunately, most of  the design work seems to be on the digital side, rather than the analog side, which may make it a poor fit for the circuits course.


Filed under: Uncategorized Tagged: Arduino, bioengineering, circuits, course design, teaching