Posts with «sparkfun» label

Tutorial – Arduino and Color LCD

Learn how to use an inexpensive colour LCD shield with your Arduino. This is chapter twenty-eight of our huge Arduino tutorial series.

Updated 03/02/2014

There are many colour LCDs on the market that can be used with an Arduino, and for this tutorial we’re using a relatively simple model available that is available from suppliers such as Tronixlabs, based on a small LCD originally used in Nokia 6100 mobile phones:

These are a convenient and inexpensive way of displaying data, or for monitoring variables when debugging a sketch. Before getting started, a small amount of work is required.

From the two examples we have seen, neither of them arrive fitted with stacking headers (or in Sparkfun’s case – not included) or pins, so before doing anything you’ll need to fit your choice of connector. Although the LCD shield arrived with stacking headers, we used in-line pins as another shield would never be placed on top:

Which can easily be soldered to the shield in a few minutes:

 While we’re on the subject of pins – this shield uses D3~D5 for the three buttons, and D8, 9, 11 and 13 for the LCD interface. The shield takes 5V and doesn’t require any external power for the backlight. The LCD module has a resolution of 128 x 128 pixels, with nine defined colours (red, green, blue, cyan, magenta, yellow, brown, orange, pink) as well as black and white.

So let’s get started. From a software perspective, the first thing to do is download and install the library for the LCD shield. Visit the library page here. Then download the .zip file, extract and copy the resulting folder into your ..arduino-1.0.xlibraries folder. Be sure to rename the folder to “ColorLCDShield“. Then restart the Arduino IDE if it was already open.

At this point let’s check the shield is working before moving forward. Once fitted to your Arduino, upload the ChronoLCD_Color sketch that’s included with the library, from the IDE Examples menu:

This will result with a neat analogue clock you can adjust with the buttons on the shield, as shown in this video.

It’s difficult to photograph the LCD – (some of them have very bright backlights), so the image may not be a true reflection of reality. Nevertheless this shield is easy to use and we will prove this in the following examples. So how do you control the color LCD shield in your sketches?

At the start of every sketch, you will need the following lines:

#include "ColorLCDShield.h"
LCDShield lcd;

as well as the following in void setup():

lcd.init(PHILIPS); 
lcd.contrast(63); // sets LCD contrast (value between 0~63)

With regards to lcd.init(), try it first without a parameter. If the screen doesn’t work, try EPSON instead. There are two versions of the LCD shield floating about each with a different controller chip. The contrast parameter is subjective, however 63 looks good – but test for yourself.

Now let’s move on to examine each function with a small example, then use the LCD shield in more complex applications.

The LCD can display 8 rows of 16 characters of text. The function to display text is:

lcd.setStr("text", y,x, foreground colour, background colour);

where x and y are the coordinates of the top left pixel of the first character in the string. Another necessary function is:

lcd.clear(colour);

Which clears the screen and sets the background colour to the parameter colour.  Please note – when referring to the X- and Y-axis in this article, they are relative to the LCD in the position shown below. Now for an example – to recreate the following display:

… use the following sketch:

// Example 28.1
#include "ColorLCDShield.h"
LCDShield lcd;

void setup()
{
 // following two required for LCD
 lcd.init(PHILIPS); 
 lcd.contrast(63); // sets LCD contrast (value between 0~63)
}

void loop()
{
 lcd.clear(BLACK);
 lcd.setStr("ABCDefghiJKLMNOP", 0,2, WHITE, BLACK);
 lcd.setStr("0123456789012345", 15,2, WHITE, BLACK);
 lcd.setStr("ABCDefghiJKLMNOP", 30,2, WHITE, BLACK);
 lcd.setStr("0123456789012345", 45,2, WHITE, BLACK);
 lcd.setStr("ABCDefghiJKLMNOP", 60,2, WHITE, BLACK);
 lcd.setStr("0123456789012345", 75,2, WHITE, BLACK);
 lcd.setStr("ABCDefghiJKLMNOP", 90,2, WHITE, BLACK);
 lcd.setStr("0123456789012345", 105,2, WHITE, BLACK);
 do {} while (1>0);
}

In example 28.1 we used the function lcd.clear(), which unsurprisingly cleared the screen and set the background a certain colour.

Let’s have a look at the various background colours in the following example. The lcd.clear()  function is helpful as it can set the entire screen area to a particular colour. As mentioned earlier, there are the predefined colours red, green, blue, cyan, magenta, yellow, brown, orange, pink, as well as black and white. Here they are in the following example:

// Example 28.2

int del = 1000;
#include "ColorLCDShield.h"
LCDShield lcd; 
void setup() 
{ 
  // following two required for LCD 
  lcd.init(PHILIPS); 
  lcd.contrast(63); // sets LCD contrast (value between 0~63) 
}

void loop()
{
 lcd.clear(WHITE);
 lcd.setStr("White", 39,40, WHITE, BLACK);
 delay(del);
 lcd.clear(BLACK);
 lcd.setStr("Black", 39,40, WHITE, BLACK);
 delay(del);
 lcd.clear(YELLOW);
 lcd.setStr("Yellow", 39,40, WHITE, BLACK);
 delay(del);
 lcd.clear(PINK);
 lcd.setStr("Pink", 39,40, WHITE, BLACK);
 delay(del);
 lcd.clear(MAGENTA);
 lcd.setStr("Magenta", 39,40, WHITE, BLACK);
 delay(del);
 lcd.clear(CYAN);
 lcd.setStr("Cyan", 39,40, WHITE, BLACK);
 delay(del);
 lcd.clear(BROWN);
 lcd.setStr("Brown", 39,40, WHITE, BLACK);
 delay(del);
 lcd.clear(ORANGE);
 lcd.setStr("Orange", 39,40, WHITE, BLACK);
 delay(del);
 lcd.clear(BLUE);
 lcd.setStr("Blue", 39,40, WHITE, BLACK);
 delay(del);
 lcd.clear(RED);
 lcd.setStr("Red", 39,40, WHITE, BLACK);
 delay(del);
 lcd.clear(GREEN);
 lcd.setStr("Green", 39,40, WHITE, BLACK);
 delay(del);
}

And now to see it in action. In this demonstration video the colours are more livid in real life, unfortunately the camera does not capture them so well.


Now that we have had some experience with the LCD library’s functions, we can move on to drawing some graphical objects. Recall that the screen has a resolution of 128 by 128 pixels. We have four functions to make use of this LCD real estate, so let’s see how they work. The first is:

lcd.setPixel(int colour, Y, X);

This function places a pixel (one LCD dot) at location x, y with the colour of colour.

Note – in this (and all the functions that have a colour parameter) you can substitute the colour (e.g. BLACK) for a 12-bit RGB value representing the colour required. Next is:

lcd.setLine(x0, y0, x1, y1, COLOUR);

Which draws a line of colour COLOUR, from position x0, y0 to x1, y1. Our next function is:

lcd.setRect(x0, y0, x1, y1, fill, COLOUR);

This function draws an oblong or square of colour COLOUR with the top-left point at x0, y0 and the bottom right at x1, y1. Fill is set to 0 for an outline, and 1 for a filled oblong. It would be convenient for drawing bar graphs for data representation. And finally, we can also create circles, using:

lcd.setCircle(x, y, radius, COLOUR);

X and Y is the location for the centre of the circle, radius and COLOUR are self-explanatory. We will now use these graphical functions in the following demonstration sketch:

// Example 28.3

#include "ColorLCDShield.h"
LCDShield lcd;
int del = 1000;
int xx, yy = 0;

void setup()
{
  lcd.init(PHILIPS); 
  lcd.contrast(63); // sets LCD contrast (value between 0~63)
  lcd.clear(BLACK);
  randomSeed(analogRead(0));
}

void loop()
{
  lcd.setStr("Graphic Function", 40,3, WHITE, BLACK);
  lcd.setStr("Test Sketch", 55, 20, WHITE, BLACK); 
  delay(5000);
  lcd.clear(BLACK);
  lcd.setStr("lcd.setPixel", 40,20, WHITE, BLACK);
  delay(del);
  lcd.clear(BLACK);
  for (int a=0; a<500; a++)
  {
    xx=random(160);
    yy=random(160);
    lcd.setPixel(WHITE, yy, xx);
    delay(10);
  }
  delay(del);
  lcd.clear(BLACK);
  lcd.setStr("LCDDrawCircle", 40,10, WHITE, BLACK);
  delay(del);
  lcd.clear(BLACK); 
  for (int a=0; a<2; a++)
  {
    for (int b=1; b<6; b++)
    {
      xx=b*5;
      lcd.setCircle(32, 32, xx, WHITE);
      delay(200);
      lcd.setCircle(32, 32, xx, BLACK);
      delay(200);
    }
  }
  lcd.clear(BLACK); 
  for (int a=0; a<3; a++)
  {
    for (int b=1; b<12; b++)
    {
      xx=b*5;
      lcd.setCircle(32, 32, xx, WHITE);
      delay(100);
    }
    lcd.clear(BLACK);
  }
  lcd.clear(BLACK); 
  for (int a=0; a<3; a++)
  {
    for (int b=1; b<12; b++)
    {
      xx=b*5;
      lcd.setCircle(32, 32, xx, WHITE);
      delay(100);
    }
    lcd.clear(BLACK);
  }
  delay(del);
  lcd.clear(BLACK);
  lcd.setStr("LCDSetLine", 40,10, WHITE, BLACK);
  delay(del);
  lcd.clear(BLACK); 
  for (int a=0; a<160; a++)
  {
    xx=random(160);
    lcd.setLine(a, 1, xx, a, WHITE);
    delay(10);
  }
  lcd.clear(BLACK);
  lcd.setStr("LCDSetRect", 40,10, WHITE, BLACK);
  delay(del);
  lcd.clear(BLACK); 
  for (int a=0; a<10; a++)
  {
    lcd.setRect(32,32,64,64,0,WHITE);
    delay(200);
    lcd.clear(BLACK);
    lcd.setRect(32,32,64,64,1,WHITE);
    delay(200);
    lcd.clear(BLACK); 
  }
  lcd.clear(BLACK); 
}

The results of this sketch are shown in this video. For photographic reasons, I will stick with white on black for the colours.

So now you have an explanation of the functions to drive the screen – and only your imagination is holding you back.

Conclusion

Hopefully this tutorial is of use to you. and you’re no longer wondering “how to use a color LCD with Arduino”. They’re available from our tronixlabs store. And if you enjoyed this article, or want to introduce someone else to the interesting world of Arduino – check out my book (now in a third printing!) “Arduino Workshop”.

Have fun and keep checking into tronixstuff.com. Why not follow things on twitterGoogle+, subscribe  for email updates or RSS using the links on the right-hand column, or join our forum – dedicated to the projects and related items on this website. Sign up – it’s free, helpful to each other –  and we can all learn something.

Visualized: Arduino Uno shows up in NASA's Swamp Works facility

There are certain things you'd expect to encounter on a visit to NASA's Swamp Works research facility. Walking into the former Apollo testing facility, you'll almost certainly catch glimpses of martian rovers, soil samples and an assortment of scientific testing devices. But in spite of Arduino's near ubiquity these days, we'll admit that we were a bit taken aback when the familiar blue microcontroller made an appearance on a lab desk during our conversation with NASA "lighting guy," Dr. Eirik Holbert. It seems that NASA, like pretty much everyone else, is experimenting with the hacker-friendly component.

The board was hooked up to a lighting fixture Holbert is working on as part of NASA's upcoming deep space habitat concept generator. It's an attempt to bring some sunlit consistency to space exploration, simulating Earth-like lighting patterns to help keep the crew alert and get them ready for sleep in the evenings. So, where does NASA turn when it's looking to conserve weight and save some taxpayer money in the process? Toward the Arduino Uno, naturally. Holbert assembled a number of off-the-shelf products, including the aforementioned microcontroller and shields from Sparkfun to make a fixture for under $500.

Asked whether we might be seeing an Arduino setup like this on an upcoming mission, Dr. Holbert told us, "I'm all about interchangeability. If they can make something space compatible, I'd be all for it."

Filed under: Science

Comments

Engadget 21 Feb 07:33

Tutorial: Arduino and the MSGEQ7 Spectrum Analyzer

This is a tutorial on using the MSGEQ7 Spectrum Analyser with Arduino, and chapter forty-eight of a series originally titled “Getting Started/Moving Forward with Arduino!” by John Boxall – A tutorial on the Arduino universe. The first chapter is here, the complete series is detailed here.

Updated 10/11/2014

In this article we’re going to explain how to make simple spectrum analysers with an Arduino-style board. (Analyser? Analyzer? Take your pick).

First of all, what is a spectrum analyser? Good question. Do you remember what  this is?

It’s a mixed graphic equaliser/spectrum analyser deck for a hi-fi system. The display in the middle is the spectrum analyser, and roughly-speaking it shows the strength of  different frequencies in the music being listened to – and looked pretty awesome doing it. We can recreate displays similar to this for entertainment and also as a base for creative lighting effects. By working through this tutorial you’ll have the base knowledge to recreate these yourself.

We’ll be using the MSGEQ7 “seven band graphic equaliser IC” from Mixed Signal Integration. Here’s the MSGEQ7 data sheet (.pdf).  This little IC can accept a single audio source, analyse seven frequency bands of the audio, and output a DC representation of each frequency band. This isn’t super-accurate or calibrated in any way, but it works. You can get the IC separately, for example:


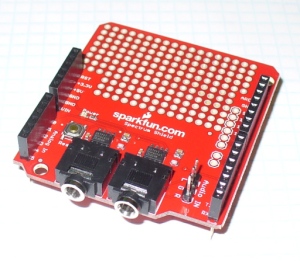
and then build your own circuit around it… or like most things in the Arduino world – get a shield. In this case, a derivative of the original Bliptronics shield by Sparkfun. It’s designed to pass through stereo audio via 3.5mm audio sockets and contains two MSGEQ7s, so we can do a stereo analyser:

As usual Sparkfun have saved a few cents by not including the stackable header sockets, so you’ll need to buy and solder those in yourself. There is also space for three header pins for direct audio input (left, right and common), which are useful – so if you can add those as well.

So now you have a shield that’s ready for use. Before moving forward let’s examine how the MSGEQ7 works for us. As mentioned earlier, it analyses seven frequency bands. These are illustrated in the following graph from the data sheet:

It will return the strengths of the audio at seven points – 63 Hz, 160 Hz, 400 Hz, 1 kHz, 2.5 kHz, 6.25 kHz and 16 kHz – and as you can see there is some overlap between the bands. The strength is returned as a DC voltage – which we can then simply measure with the Arduino’s analogue input and create a display of some sort. At this point audio purists, Sheldonites and RF people might get a little cranky, so once again – this is more for visual indication than any sort of calibration device.

However as an 8-pin IC a different approach is required to get the different levels. The IC will sequentially give out the levels for each band on pin 3- e.g. 63 Hz then 160 Hz then 400 Hz then 1 kHz then 2.5 kHz then 6.25 kHz  then 16 kHz then back to 63 Hz and so on. To start this sequence we first reset the IC by pulsing the RESET pin HIGH then low. This tells the IC to start at the first band. Next, we set the STROBE pin to LOW, take the DC reading from pin 3 with analogue input, store the value in a variable (an array), then set the STROBE pin HIGH. We repeat the strobe-measure sequence six more times to get the rest of the data, then RESET the IC and start all over again. For the visual learners consider the diagram below from the data sheet:

To demonstrate this process, consider the function

readMSGEQ7()

in the following example sketch:

// Example 48.1 - tronixstuff.com/tutorials > chapter 48 - 30 Jan 2013 
// MSGEQ7 spectrum analyser shield - basic demonstration
int strobe = 4; // strobe pins on digital 4
int res = 5; // reset pins on digital 5
int left[7]; // store band values in these arrays
int right[7];
int band;
void setup()
{
 Serial.begin(115200);
 pinMode(res, OUTPUT); // reset
 pinMode(strobe, OUTPUT); // strobe
 digitalWrite(res,LOW); // reset low
 digitalWrite(strobe,HIGH); //pin 5 is RESET on the shield
}
void readMSGEQ7()
// Function to read 7 band equalizers
{
 digitalWrite(res, HIGH);
 digitalWrite(res, LOW);
 for(band=0; band <7; band++)
 {
 digitalWrite(strobe,LOW); // strobe pin on the shield - kicks the IC up to the next band 
 delayMicroseconds(30); // 
 left[band] = analogRead(0); // store left band reading
 right[band] = analogRead(1); // ... and the right
 digitalWrite(strobe,HIGH); 
 }
}
void loop()
{
 readMSGEQ7();
 // display values of left channel on serial monitor
 for (band = 0; band < 7; band++)
 {
 Serial.print(left[band]);
 Serial.print(" ");
 }
 Serial.println();
// display values of right channel on serial monitor
 for (band = 0; band < 7; band++)
 {
 Serial.print(right[band]);
 Serial.print(" ");
 }
 Serial.println();
}

If you follow through the sketch, you can see that it reads both left- and right-channel values from the two MSGEQ7s on the shield, then stores each value in the arrays left[] and right[]. These values are then sent to the serial monitor for display – for example:

If you have a function generator, connect the output to one of the channels and GND – then adjust the frequency and amplitude to see how the values change. The following video clip is a short demonstration of this – we set the generator to 1 kHz and adjust the amplitude of the signal. To make things easier to read we only measure and display the left channel:


Keep an eye on the fourth column of data – this is the analogRead() value returned by the Arduino when reading the 1khz frequency band. You can also see the affect on the other bands around 1 kHz as we increase and decrease the frequency. However that wasn’t really visually appealing – so now we’ll create a small and large graphical version.

First we’ll use an inexpensive LCD, the I2C model from akafugu reviewed previously. To save repeating myself, also review how to create custom LCD characters from here.

With the LCD with have two rows of sixteen characters. The plan is to use the top row for the levels, the left-channel’s on … the left, and the right on the right. Each character will be a little bar graph for the level. The bottom row can be for a label. We don’t have too many pixels to work with, but it’s a compact example:

We have eight rows for each character, and the results from an analogueRead() fall between 0 and 1023. So that’s 1024 possible values spread over eight sections. Thus each row of pixels in each character will represent 128 “units of analogue read” or around 0.63 V if the Arduino is running from true 5 V (remember your AREF notes?). The sketch will again read the values from the MSGEQ7, feed them into two arrays – then display the required character in each band space  on the LCD.

Here’s the resulting sketch:

// Example 48.2 - tronixstuff.com/tutorials > chapter 48 - 30 Jan 2013 
// MSGEQ7 spectrum analyser shield and I2C LCD from akafugu
// for akafugu I2C LCD
#include "Wire.h"
#include "TWILiquidCrystal.h"
LiquidCrystal lcd(50);
// create custom characters for LCD
byte level0[8] = { 0b00000, 0b00000, 0b00000, 0b00000, 0b00000, 0b00000, 0b00000, 0b11111};
byte level1[8] = { 0b00000, 0b00000, 0b00000, 0b00000, 0b00000, 0b00000, 0b11111, 0b11111};
byte level2[8] = { 0b00000, 0b00000, 0b00000, 0b00000, 0b00000, 0b11111, 0b11111, 0b11111};
byte level3[8] = { 0b00000, 0b00000, 0b00000, 0b00000, 0b11111, 0b11111, 0b11111, 0b11111};
byte level4[8] = { 0b00000, 0b00000, 0b00000, 0b11111, 0b11111, 0b11111, 0b11111, 0b11111};
byte level5[8] = { 0b00000, 0b00000, 0b11111, 0b11111, 0b11111, 0b11111, 0b11111, 0b11111};
byte level6[8] = { 0b00000, 0b11111, 0b11111, 0b11111, 0b11111, 0b11111, 0b11111, 0b11111};
byte level7[8] = { 0b11111, 0b11111, 0b11111, 0b11111, 0b11111, 0b11111, 0b11111, 0b11111};
int strobe = 4; // strobe pins on digital 4
int res = 5; // reset pins on digital 5
int left[7]; // store band values in these arrays
int right[7];
int band;
void setup()
{
 Serial.begin(9600);
 // setup LCD and custom characters
 lcd.begin(16, 2);
 lcd.setContrast(24);
 lcd.clear();
lcd.createChar(0,level0);
 lcd.createChar(1,level1);
 lcd.createChar(2,level2);
 lcd.createChar(3,level3);
 lcd.createChar(4,level4);
 lcd.createChar(5,level5);
 lcd.createChar(6,level6);
 lcd.createChar(7,level7);
 lcd.setCursor(0,1);
 lcd.print("Left");
 lcd.setCursor(11,1);
 lcd.print("Right");
 pinMode(res, OUTPUT); // reset
 pinMode(strobe, OUTPUT); // strobe
 digitalWrite(res,LOW); // reset low
 digitalWrite(strobe,HIGH); //pin 5 is RESET on the shield
}
void readMSGEQ7()
// Function to read 7 band equalizers
{
 digitalWrite(res, HIGH);
 digitalWrite(res, LOW);
 for( band = 0; band < 7; band++ )
 {
 digitalWrite(strobe,LOW); // strobe pin on the shield - kicks the IC up to the next band 
 delayMicroseconds(30); // 
 left[band] = analogRead(0); // store left band reading
 right[band] = analogRead(1); // ... and the right
 digitalWrite(strobe,HIGH); 
 }
}
void loop()
{
 readMSGEQ7();
// display values of left channel on LCD
 for( band = 0; band < 7; band++ )
 {
 lcd.setCursor(band,0);
 if (left[band]>=895) { lcd.write(7); } else
 if (left[band]>=767) { lcd.write(6); } else
 if (left[band]>=639) { lcd.write(5); } else
 if (left[band]>=511) { lcd.write(4); } else
 if (left[band]>=383) { lcd.write(3); } else
 if (left[band]>=255) { lcd.write(2); } else
 if (left[band]>=127) { lcd.write(1); } else
 if (left[band]>=0) { lcd.write(0); }
 }
 // display values of right channel on LCD
 for( band = 0; band < 7; band++ )
 {
 lcd.setCursor(band+9,0);
 if (right[band]>=895) { lcd.write(7); } else
 if (right[band]>=767) { lcd.write(6); } else
 if (right[band]>=639) { lcd.write(5); } else
 if (right[band]>=511) { lcd.write(4); } else
 if (right[band]>=383) { lcd.write(3); } else
 if (right[band]>=255) { lcd.write(2); } else
 if (right[band]>=127) { lcd.write(1); } else
 if (right[band]>=0) { lcd.write(0); }
 }
}

If you’ve been reading through my tutorials there isn’t anything new to worry about. And now for the demo, with sound –

That would look great on the side of a Walkman, however it’s a bit small. Let’s scale it up by using a Freetronics Dot Matrix Display – you may recall these from Clock One. For some background knowledge check the review here.  Don’t forget to use a suitable power supply for the DMD – 5 V at 4 A will do nicely. The DMD contains 16 rows of 32 LEDs. This gives us twice the “resolution” to display each band level if desired. The display style is subjective, so for this example we’ll use a single column of LEDs for each frequency band, with a blank column between each one.

We use a lot of line-drawing statements to display the levels, and clear the DMD after each display. With this and the previous sketches, there could be room for efficiency – however I write these with the beginner in mind. Here’s the sketch:

// Example 48.3 - tronixstuff.com/tutorials > chapter 48 - 30 Jan 2013 
// MSGEQ7 spectrum analyser shield with a Freetronics DMD
// for DMD
#include "DMD.h" // for DMD
#include "SPI.h" // SPI.h must be included as DMD is written by SPI (the IDE complains otherwise)
#include "TimerOne.h"
#include "SystemFont5x7.h" // keep next two lines if you want to add some text
#include "Arial_black_16.h"
DMD dmd(1, 1); // creates instance of DMD to refer to in sketch
void ScanDMD() // necessary interrupt handler for refresh scanning of DMD
{ 
 dmd.scanDisplayBySPI();
}
int strobe = 4; // strobe pins on digital 4
int res = 5; // reset pins on digital 5
int left[7]; // store band values in these arrays
int right[7];
int band;
void setup()
{
 // for DMD
 //initialize TimerOne's interrupt/CPU usage used to scan and refresh the display
 Timer1.initialize( 5000 ); //period in microseconds to call ScanDMD. Anything longer than 5000 (5ms) and you can see flicker.
 Timer1.attachInterrupt( ScanDMD ); //attach the Timer1 interrupt to ScanDMD which goes to dmd.scanDisplayBySPI() 
 dmd.clearScreen( true ); //true is normal (all pixels off), false is negative (all pixels on)

 // for MSGEQ7
 pinMode(res, OUTPUT); // reset
 pinMode(strobe, OUTPUT); // strobe
 digitalWrite(res,LOW); // reset low
 digitalWrite(strobe,HIGH); //pin 5 is RESET on the shield
}
void readMSGEQ7()
// Function to read 7 band equalizers
{
 digitalWrite(res, HIGH);
 digitalWrite(res, LOW);
 for( band = 0; band < 7; band++ )
 {
 digitalWrite(strobe,LOW); // strobe pin on the shield - kicks the IC up to the next band 
 delayMicroseconds(30); // 
 left[band] = analogRead(0); // store left band reading
 right[band] = analogRead(1); // ... and the right
 digitalWrite(strobe,HIGH); 
 }
}
void loop()
{
 int xpos;
 readMSGEQ7();
 dmd.clearScreen( true ); 
 // display values of left channel on DMD
 for( band = 0; band < 7; band++ )
 {
 xpos = (band*2)+1;
 if (left[band]>=895) { dmd.drawLine( xpos, 15, xpos, 1, GRAPHICS_NORMAL ); } else
 if (left[band]>=767) { dmd.drawLine( xpos, 15, xpos, 3, GRAPHICS_NORMAL ); } else
 if (left[band]>=639) { dmd.drawLine( xpos, 15, xpos, 5, GRAPHICS_NORMAL ); } else
 if (left[band]>=511) { dmd.drawLine( xpos, 15, xpos, 7, GRAPHICS_NORMAL ); } else
 if (left[band]>=383) { dmd.drawLine( xpos, 15, xpos, 9, GRAPHICS_NORMAL ); } else
 if (left[band]>=255) { dmd.drawLine( xpos, 15, xpos, 11, GRAPHICS_NORMAL ); } else
 if (left[band]>=127) { dmd.drawLine( xpos, 15, xpos, 13, GRAPHICS_NORMAL ); } else
 if (left[band]>=0) { dmd.drawLine( xpos, 15, xpos, 15, GRAPHICS_NORMAL ); }
 }

 // display values of right channel on DMD
 for( band = 0; band < 7; band++ )
 {
 xpos = (band*2)+18;
 if (right[band]>=895) { dmd.drawLine( xpos, 15, xpos, 1, GRAPHICS_NORMAL ); } else
 if (right[band]>=767) { dmd.drawLine( xpos, 15, xpos, 3, GRAPHICS_NORMAL ); } else
 if (right[band]>=639) { dmd.drawLine( xpos, 15, xpos, 5, GRAPHICS_NORMAL ); } else
 if (right[band]>=511) { dmd.drawLine( xpos, 15, xpos, 7, GRAPHICS_NORMAL ); } else
 if (right[band]>=383) { dmd.drawLine( xpos, 15, xpos, 9, GRAPHICS_NORMAL ); } else
 if (right[band]>=255) { dmd.drawLine( xpos, 15, xpos, 11, GRAPHICS_NORMAL ); } else
 if (right[band]>=127) { dmd.drawLine( xpos, 15, xpos, 13, GRAPHICS_NORMAL ); } else
 if (right[band]>=0) { dmd.drawLine( xpos, 15, xpos, 15, GRAPHICS_NORMAL ); }
 }
}

… and here it is in action:

Conclusion

At this point you have the knowledge to use the MSGEQ7 ICs to create some interesting spectrum analysers for entertainment and visual appeal – now you just choose the type of display enjoy the results. And if you enjoyed this article, or want to introduce someone else to the interesting world of Arduino – check out my book (now in a fourth printing!) “Arduino Workshop”.

Have fun and keep checking into tronixstuff.com. Why not follow things on twitterGoogle+, subscribe  for email updates or RSS using the links on the right-hand column, or join our forum – dedicated to the projects and related items on this website.

The post Tutorial: Arduino and the MSGEQ7 Spectrum Analyzer appeared first on tronixstuff.

BeetBox drops a beat with a side of Raspberry Pi, and other plant puns (video)

Sometimes the plays on words are unavoidable -- in fact, they form the very heart of Scott Garner's recent musical creation. His BeetBox turns six of its namesake root vegetables into drum pads through SparkFun capacitive touch sensors, all of which are controlled by (what else?) a Raspberry Pi. Cleverness goes beyond the core technology and food jokes, as well. All of the circuitry and audio equipment is hidden within the wood box, making it look more like a horticultural project than machinery. We don't mind the lack of production plans when there's source code available; we're mostly curious as to what in our garden would make for a good rhythm section.

[Image credit: Scott Garner, Flickr]

Continue reading BeetBox drops a beat with a side of Raspberry Pi, and other plant puns (video)

Filed under: Misc, Alt

Comments

Via: Gizmag

Source: Scott Made This

Engadget 20 Dec 05:58

Self-balancing unicycle using Arduino and Sparkfun IMU

Here’s proof that you can build cool stuff with simple tools. This self-balancing unicycle uses an Arduino and a five degree of freedom IMU from Sparkfun to keep the rider upright. Well, it’ll keep you upright as long as you have good side-to-side balance. But that’s true of any unicycle, right?

The Raptor was built by [Nick Thatcker] who is no stranger to self-balancing transportation. A few years back he built a Segway clone and the same type of geared motor used in that project also went into this one. I connects to the wheel with a chain, allowing him to keep the motor hidden in the saddle. He gets between 90 and 120 minutes of used on one charge with a top speed of 10 MPH. The motor could move you along faster but he has limited this in firmware to ensure it has enough power to ‘catch up’ if you lean too far forward.

Don’t miss the demo after the break. If you like this unicycle there are several others worth looking at.


Filed under: transportation hacks

12 DOF hexapod kit now sold by SparkFun

The 12 DOF hexapod kit from DAGU is one of the simplest hexapod kits ever!

Quick and easy to assemble, the body only consist of 12 leg segments, 12 foam rubber feet, 12 servos and a base plate with a hole pattern that allows controllers and sensors to be easily mounted.

read more

Let's Make Robots 26 Oct 18:09
12  advertising  arduino  dagu  dof  fun  hexapod  servo  spark  sparkfun  

Spider controller now sold by SparkFun

The DAGU Red back Spider controller is an Arduino Mega (1280) compatible controller that is especially designed for driving a large number of servos. All 70 I/O pins are terminated in servo compatible 3pin male headers as well as the standard female header and the power supply is a switchmode power supply delivering 5V @ 3A from an input voltage of 7V - 32V.

read more

Let's Make Robots 26 Oct 17:41
1280  48  advertising  arduino  atmega  controller  dagu  fun  robot  servos  spark  sparkfun  spider  

SparkFun launches ProtoSnap MiniBot for the budding roboticist

SparkFun struck a chord with many when it released the ProtoSnap series last year. The perforated perfboard housed not only a tiny Arduino compatible chip, but a small host of sensors and components that made assembling simple projects a snap (pun not only intended, but relished). Tomorrow, the company will begin selling the next member of its ProtSnap family -- the MiniBot. Just like its predecessors, the ProtoSnap MiniBot is based around an Arduino compatible microcontroller (specifically ATmega328) and features a number of components that can easily be detached when you're ready to move from prototype to a more permanent arrangement. The onboard selection components is fairly limited. The base is a relatively bare perfboard with a 9v battery holder on one side and two wheels connected to a motor on the other. Up front is two IR sensors that can be used for basic controls.

Of course, it's simple enough to expand on the basic platform with any host of sensors and components, like servos or RF receivers. Ultimately it's up to your imagination and skill level, which is why SparkFun is primarily targeting the kits at the educational market. The company's new educational outreach program is making a big push to put the ProtoSnap MiniBot in classrooms across the country, starting with high schools and trade schools, as a bridge from more simplistic robotics kits to the more advanced projects tackled at the university level. The completely open source robotics platform will be available tomorrow for $74.95. As soon as we can get our mitts on one our own we'll return with a thorough hands on... one that reveals just how much smarter the average high school kid is than us.

SparkFun launches ProtoSnap MiniBot for the budding roboticist originally appeared on Engadget on Thu, 31 May 2012 16:46:00 EST. Please see our terms for use of feeds.

Permalink | Email this | Comments

Sphero goes modular, spins out for a drive (video)


Sphero's hooked up with a new whip, albeit a retro-fitted one. Skylar, a Junior Developer at Orbotix, modded an old RC car with an Arduino board, H-bridge and a few trackball parts, enabling the remote control ball to serve as its brain. Just in time too -- there's only so much fun you can have getting the little orb stuck behind the filing cabinets. Still, it's certainly a leap beyond purposing it to pull an iPhone-toting chariot.

Sean Buckley contributed to this post.

Sphero goes modular, spins out for a drive (video) originally appeared on Engadget on Mon, 19 Mar 2012 02:36:00 EST. Please see our terms for use of feeds.

Permalink | Email this | Comments

Magnetometer and accelerometer read simultaneously

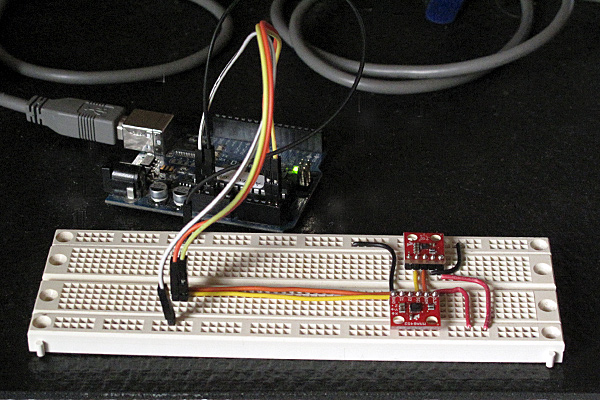
In Learning to Use I2C and Magnetometer not fried, I talked about interfacing the MAG3110 magnetometer and MQA8452Q accelerometer to an Arduino.  For both, I’m using breakout boards from Sparkfun Electronics.

I  checked today that there are no problems when I connect both devices to the same I2C bus.

The first test was very simple: I put both the breakout boards into a breadboard and wired them together, then tried running each of the programs I’d written for the chips separately. Result: no problems—worked first time.

I then tried merging the programs (cleaning up any naming conflicts) so that both could be run from the same code.  After a few typo fixes, this also worked fine

I think I’m now ready to hand over the software to the students to use for their robot.

I still need to put the i2c.h, i2c.cpp, and accel_magnet code in some public place for others to use (perhaps on github? maybe on my web pages at work?) [UPDATE 2012-jan-31: I have put the libraries and the sample code for the accelerometer and magnetometer at http://users.soe.ucsc.edu/~karplus/Arduino/]

One thing that is still missing is doing tilt correction for the compass heading.  Since the ROV is not expected to remain level (the accelerometer is intended to be used in a feedback loop to adjust the pitch, with anything from -90° to +90° being reasonable), getting a good compass heading requires rotating the magnetometer readings into the horizontal plane.  Only one of the students in the robotics club has had trigonometry or matrix math, so I’ll have to work with him to get him to figure out how to do the tilt correction. It may be simplest conceptually  to compute pitch and roll angles first, then rotate twice, rather than trying to do the whole tilt correction in one step (especially since the Arduino does not have matrix libraries).

Related articles

Tagged: accelerometer, Arduino, I²C, magnetometer, robotics, SparkFun, SparkFun Electronics