Posts with «op amp» label

Random thoughts on circuits labs

DNA melting

I spent some time yesterday thinking about whether we could do optical detection of DNA (particularly some variant of the DNA melting lab from MIT—see also the Fall 2008 class handouts).  I noted in the 2008 handouts that they were using a blue LED array driven by a 0.29A current source (made from an LM317T voltage regulator, a rather inefficient method). The wiki page uses a regulated 5V supply and a 25Ω series resistor, which would be around 60–70mA for a typical forward drop of 3.2–3.5V in a blue LED.  That’s still a pretty powerful light source for an LED. They say they are using LZ1-00B200, which has a 3.6V forward voltage, but can handle a full amp of current, so is more LED than is needed.

We can get a blue LED for under $2 that can handle 50mA continuously (LTL911CBKS5), though it has a forward voltage of typically 4.3V.  In surface mount for $1.14, we could get MLEBLU-A1-0000-000T01, which has a dominant wavelength of 465–485nm (depending on bin code) and a luminous flux of 10.7 lm at 150mA (forward voltage 3.2V).  I estimate the LED MIT mentions produces about 6lm at that current.  The expensive part of the illumination is not the LED, but the focusing lenses to concentrate the light and the optical filtering needed to keep the excitation wavelength from being detected by the photodiode.

I was thinking that it would be cool to use a laser as an excitation source, rather than an LED, since then no lenses or filter would be needed on the source—just a blocking filter on the photoreceptor. Unfortunately, blue lasers are very expensive.  What are cheap are the blue-violet lasers at 405nm, since the laser diodes are made in quantity for BluRay players. (Amazon has 405nm laser pointers for under $10 with shipping.) Unfortunately the usual fluorescent dyes used for DNA melting measurements (SYBR Green, LC Green Plus, EvaGreen) are not excited at 405nm, and need excitation wavelengths in the range 440nm–470nm).  I’ve been wondering whether one of the 405nm-sensitive dyes used in flow cytometry (like Sytox Blue dead cell stain) could be used.  But I’ve not found a double-stranded DNA dye for sale that is easily excited at 405nm (even Sytox Blue is way down in sensitivity from its peak), so laser excitation seems to be out—the excitation wavelengths needed for standard dyes require fairly expensive lasers.  The benchtop lasers usually used in labs and flow cytometry equipment are priced in the “if-you-have-to-ask” price range.  Buying enough copies for a student lab is more than this lab is worth.

I still don’t see a way to make the DNA melting curve project work within our course.  Even MIT gives up half a semester to this lab, and we don’t have that much time (nor that caliber of students, on average).

Soldering project

I want the students to learn to solder (at least through-hole parts, not necessarily surface-mount). I don’t want to do the traditional blinky-light soldering practice, so I’ve been looking for a place in the course where it makes sense to require soldering, rather than wiring up a breadboard.

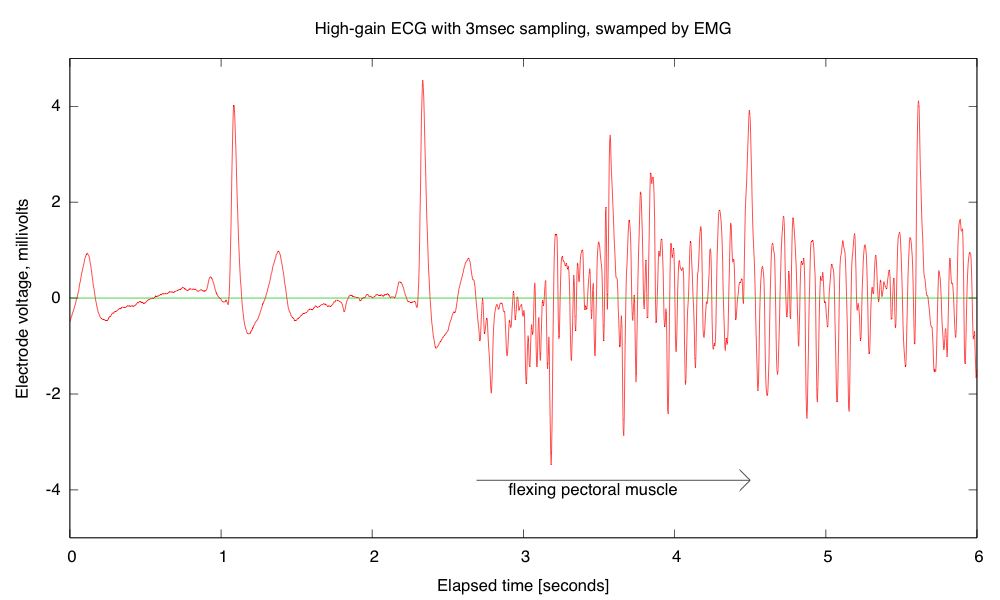
Breadboards have problems with loose wires, so the more complex the circuit, the more problems a breadboard causes.  Breadboards also have problems connecting to wires that have to leave the breadboard—particularly wires to moving objects.  This suggests that the EKG/EMG circuit would be the most appropriate as a soldering project, as it is fairly complicated and the long wires to the Ag/AgCl gel electrodes can cause a lot of problems with loose connections (my first check on debugging is to wiggle the header pins for those wires).

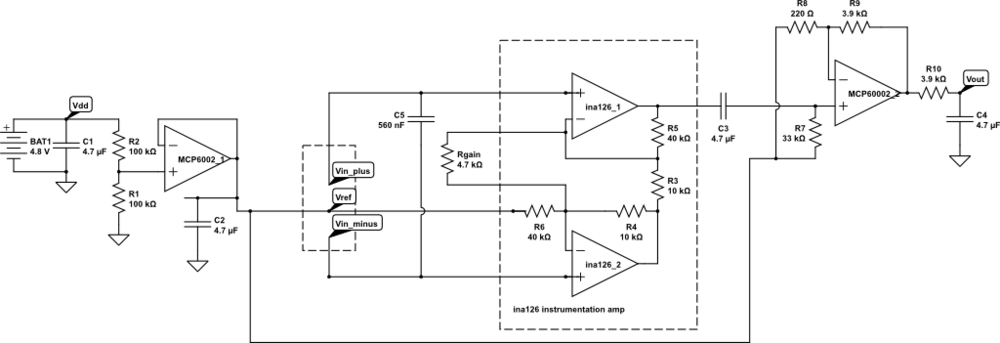
But I want the students to be doing some designing for the EKG circuit, not just soldering up a predetermined circuit, so I’m thinking of designing an instrumentation-amp protoboard, which has an ina126 instrumentation amp and an MCP6002 dual op amp chip, with power pins wired up and a place for the Rgain resistor and bypass capacitors, but everything else in a breadboard-like configuration, so that resistors, capacitors, and jumper wires could be added.   Off-board connections could be done with screw terminals to make sturdy connections.

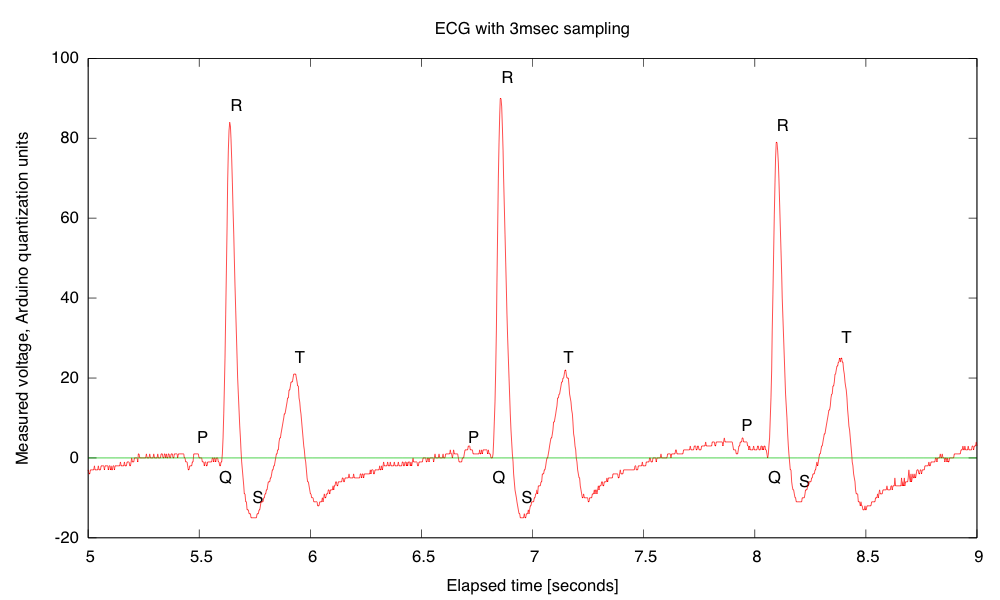
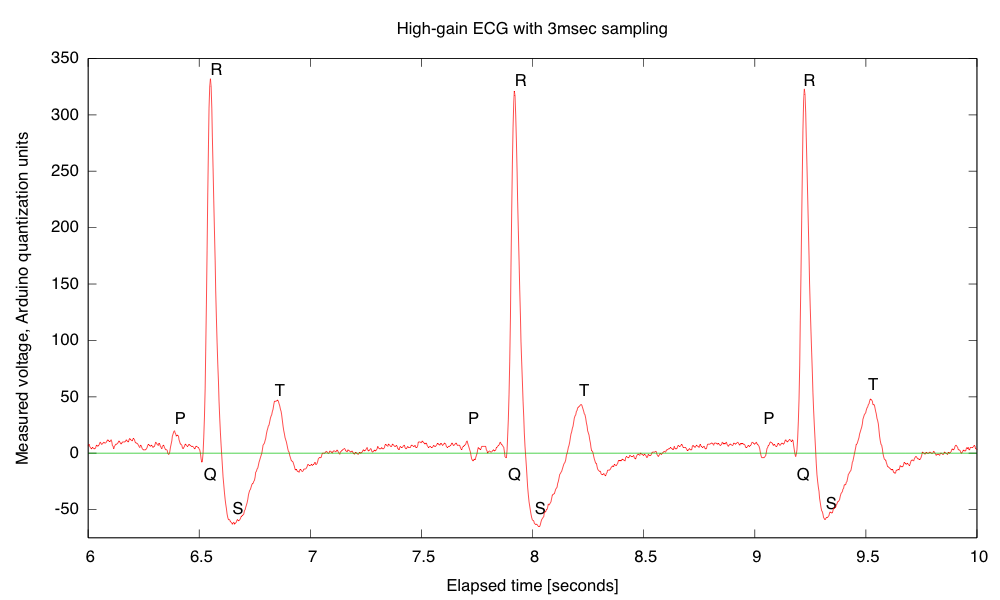
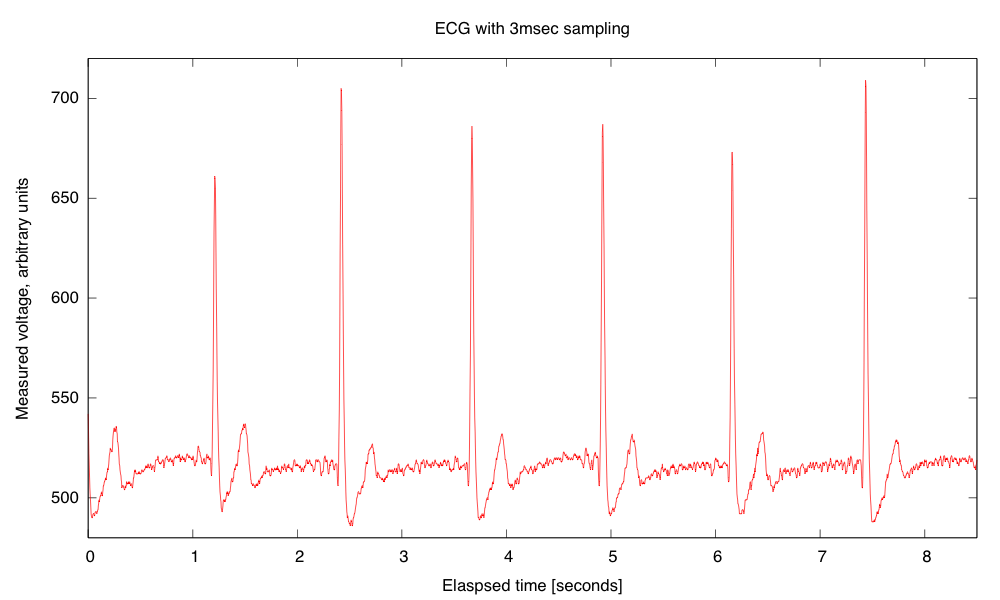
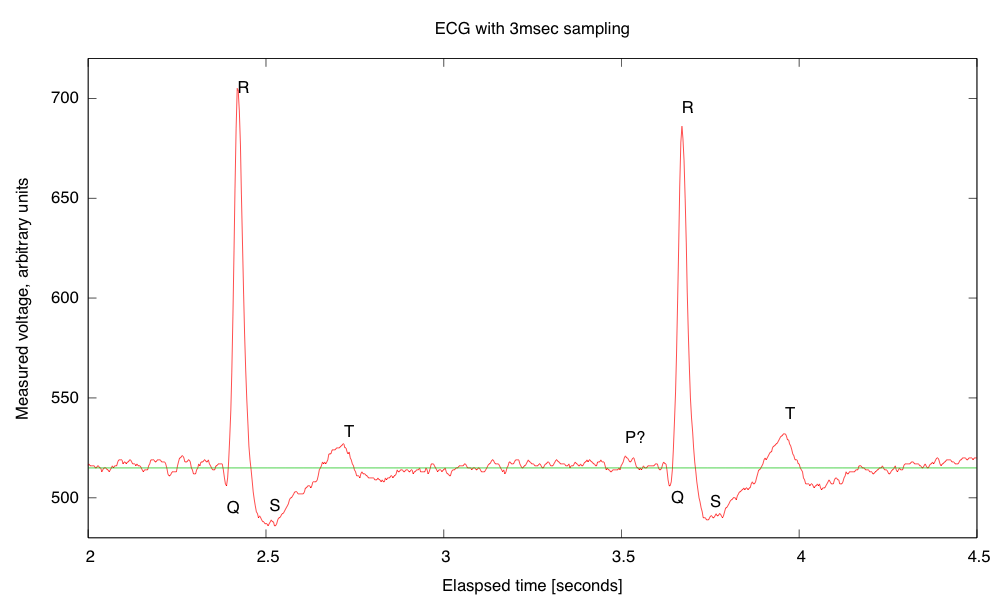
My son and I came up with the further idea of adding an optional LED output, to make a blinky-light-EKG device.  I think that the approximately 1.5V, 30msec pulse that I was seeing for the R segment of the EKG would be enough to make a visible flash—I’ll have to try it out on my breadboard.  I tried it today, but I was only seeing 0.5V pulses today (poorer contact with the electrodes?), and I had to raise the 3.9kΩ feedback resistor to 10kΩ to increase the gain of the final stage., which was enough to get weak flashes from an LED with a 100Ω series resistor.  Because the op amp has limited output current (±23mA short circuit), I felt it fairly safe to put the LED directly between the op amp output and the Vref signal, which gives a good flash even with a green LED.

The lower voltage that I got this time (until I raised the gain) makes it clear that if I do make an EKG protoboard, it should have room for some trim pots for adjusting the final gain.


Filed under: Circuits course Tagged: Arduino, bioengineering, blinking light, circuits, course design, DNA melting, ECG, EKG, electrocardiogram, instrumentation amplifier, laser, op amp, pulse, violet lasers

More thoughts on EKG

Before doing the EKG lab, we should definitely discuss safety concerns,  including things like the following chart (information from http://electronicstechnician.tpub.com/14086/css/14086_34.htm):

Human reaction at 60Hz Current in mA
 Perception—slight tingling sensation  1.1
 Can’t let go (120 lb. person)—arm and hand muscles close involuntarily  10.0
 Can’t let go (175 lb. person)  16.0
 Can’t breathe—paralysis of the chest muscles  18.0
 Heart fibrillation—rapid irregular contractions of the heart muscles, which could be fatal  65.0

The very small voltages we work with (5–10 V DC) means that we rarely need to be concerned about safety issues in the lab. Most of the resistance of the body comes from the skin, and varies enormously according to how sweaty the skin is. Cleaning dead skin cells off (as is done with most preps for EKG electrodes) reduces the resistance of the skin quite a bit. DC is somewhat safer than AC, because skin is less conducting than the rest of the body, and so acts as a capacitor in parallel with a resistor. Puncturing or scraping the skin reduces resistance considerably.

It would probably be useful to have students measure the resistance between two Ag/AgCl electrodes and compute the currents that would flow at different voltages. When I tried this on two chest electrodes (just after showering, so clean, damp skin) I measured around 50kΩ. Pressing the electrodes more firmly against the skin dropped the resistance to 25 kΩ, and it gradually crept back up.

I keep thinking that the 3-wire design for EKGs is overkill. The 3rd wire seems to be just provided to bias the body to be between the power rails of the instrumentation amplifier. It should be sufficient to bias one of the electrodes with a large resistor to the reference voltage directly, rather than through the body.

I tried this.  First I hooked up the 3-wire system of the 2-stage EKG amplifier (though there was a mistake on that post, as the Rgain resistor was really 4.7kΩ, not 820Ω).  This was to make sure that I was getting good contacts and a clean signal. I then disconnected the bias lead and tried to bias the opposite end of the wires.  This did not work at all.  Disconnecting the bias wire resulted in a large signal with a period of 16.7ms (60Hz, though with a complex waveform).  Adding resistors between Vplus and Vref, Vminus and Vref, or both, just made this noise worse.  I then tried taking my body out of the loop, connecting a 25 kΩ resistor between the clip leads.  Without the biasing resistors I saw the same complex 60Hz signal.  It seems to come from capacitive coupling to the leads, as moving my hand closer or further from the leads changes the magnitude of the signal, and grounding myself eliminates it.  Putting 24kΩ resistors between Vplus and Vref and between Vminus and Vref reduced the noise, but did not eliminate it.  Touching either Vplus or Vminus was enough to produce huge noise again.

I tried another experiment, where I attached the ground electrode not to Vref directly, but through a 0.56 μF capacitor.  This worked fine, even though there was no DC bias connection for the instrumentation amp inputs!  It stopped working if I then touched either the +5V or 0V power rail—the DC bias is important, but my body was working as a pretty good capacitor, holding the DC bias for quite a while.  It is clear that the AC path to ground is crucial also.

I found that I could clean up the EKG signal by putting a 0.56 μF capacitor between Vplus and Vminus—enough that the P part of the EKG was visible.

Clean EMG with P,Q,R,S,T parts of signal all clearly visible. The remaining noise seems to be mainly quantization noise in the Arduino analog-to-digital converter, which could be reduced by increasing the amplifier gain.

Since the remaining noise seemed to be all quantization noise, I upped the amplifier gain.  Trying to raise the gain on the first stage did not work, so I raised the gain on the second stage.

Higher gain EKG circuit, with capacitor on the inputs.  The first-stage gain should be 22.02, and the second stage  18.73, for a total gain of 412.4.

The higher gain amplifier did produce good traces, with less evidence of quantization noise:

The “Arduino units” are 4.967 V/ 1024 = 4.851 mV at the output of the EKG, or 11.76µV at the electrodes. The R peaks are about 3.9mV and the S dips about -0.7mV.  The first R-R interval is 1.368 seconds for a pulse rate of 43.86 bpm.

One thing that is important—the EKG readings are resting EKGs.  If I flex the left pectoral muscle, I can swamp out the EKG signal.

Every EKG is also an EMG (electromyograph), and flexing muscles between the electrodes (here the left pectoral muscle) can swamp out the EKG signal. I computed the electrode voltage from the recorded signal, the measured Arduino A-to-D reference voltage, and the gain of the EKG amplifier. The zero-reference is determined by recording the Vref signal as well as the EKG output signal. The quantization noise from the A-to-D converter is about 3μV (less than 1 pixel in this picture).


Filed under: Circuits course, Data acquisition Tagged: Arduino, bioengineering, circuits, course design, ECG, EKG, electrocardiogram, instrumentation amplifier, op amp, pulse

EKG recording working

My son and I spent some time today debugging his data logger.  I also convinced him to add some documentation, though not nearly as much as I think is needed.  This version is just a text command interface, with no GUI—the PyGUI interface he was building seemed to slow things down a lot, and is not yet ready for use.

The data logger works fine as long as the sampling interval is at least 3msec.  With 2msec sampling, I think that serial communications (over a 115200 baud USB serial connection) is getting overwhelmed.  The Arduino seems to be capable of sending out data ok at 2msec/sample, though 1msec/sample causes it to miss some timer interrupts.

If the Python program can’t empty the serial port fast enough, I think that there operating system problems. My MacBook Pro sometimes gets wedged with long runs at higher sampling rates—I’ve had to reboot it a couple of times today. If the problem is with the MacBook Pro, it may be possible to run with slightly shorter sampling intervals on faster hosts, before hitting the limits of the Arduino.

I did manage to get a nice recording for about 8.5 seconds at 3msec sampling:

Recording of EKG trace on the Arduino. The value 512 represents the midpoint of the Arduino voltage scale. The EKG circuit and Arduino used separate power supplies, so the reference voltage is about 2.506V, while AREF on the Arduino was 4.96V, so the reference voltage should be about 517.  In a separate recording of the EKG signal and Vref, I found Vref to be 515±1.  The arbitrary units are about 4.844mV at the input to Arduino.  If my gain of my EKG is set to 591 as I expect from the resistor values, the arbitrary units should correspond to 8.2µV at the electrodes, and the biggest peak is about +1.6mV and the deepest drop is about -0.24mV.

I think that the signals were clearer today, because I was using a ground electrode on my chest, rather than on my elbow, reducing the common-mode noise a little. The 3msec resolution allows zooming in to get a pretty clear view of the structure of the pulses:

Detail of a couple of pulses showing the QRS complex and the T pulse. I’m not sure whether or not a P pulse is visible—if so it is almost buried in the noise. I’ve added a line where I believe that the reference voltage is, though it was not recorded on this run. The R-R interval here is about 1251±2msec for a pulse of 0.80 Hz or 48.0 bpm, which is about my usual resting pulse.

Although it took my son and me a little debugging to get everything working today, overall I’m quite pleased with the data logger code he wrote. He still has more documentation to add (both in-code and external), and there are some more features that could be added, but it is basically usable as is.

Incidentally, I found out today from Cardiology Explained by E.A. Ashley and J. Niebauer, that

ECG terminology has two meanings for the word “lead”:

  • the cable used to connect an electrode to the ECG recorder
  • the electrical view of the heart obtained from any one combination of electrodes

So it is not surprising that I was confused by the usage—I was only familiar with the first usage, which corresponds to normal engineering terminology.


Filed under: Circuits course, Data acquisition Tagged: Arduino, bioengineering, circuits, course design, ECG, EKG, electrocardiogram, instrumentation amplifier, op amp

Capacitive sensing with op amps, continued

What more can I do (or, more importantly, have the students do with the Capacitive sensing with op amps?

The circuit that I gave in that post has several parameters.  Perhaps the students should try predicting what happens when they are adjusted.

Op amp multivibrator. The first op amp is just to set up a virtual ground halfway between the power rails. The second op amp does the oscillating (at about 8.12 kHz for these components). Circuit drawn with CircuitLab, which is not capable of simulating it.

For example, what happens if Vbias is raised or lowered? What is the effect of changing each of the resistors? How can we optimize the circuit for easy, reliable detection of touches with an Arduino pulseIn() measurement?

If we pretend that the output is a rail-to-rail square wave (ignoring the slew rate limitation), analysis is pretty easy.

.

  • If the output is low, then and Vminus is higher than that, but dropping.
  • If the output is high, then and Vminus is lower than that, but rising.

If we define , we can simplify further and say that Vminus swings between two threshold voltages:   and .

The discharging curve is simply , where , so it takes 
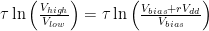
to discharge to the other threshold.

The charging curve is , and so it takes . That is, .

If we want a symmetric waveform, we need to have , which in turn requires . Raising Vbias makes the low part of the output waveform shorter and the high part longer. Conversely, lowering Vbias makes the low part longer and the high part shorter.

The total period is  .  If we set Vbias to Vdd/2, then we can simplify further to .

The sum R4+R5 only affects the amount of current that the Vbias supply has to provide, but it is probably a good idea to make it fairly large, and to add a bypass capacitor to Vbias, to prevent noise coupling though the bias supply.

When using pulseIn() on the Arduino to measure the capacitance C1, we want to have a large change in the pulse duration (to avoid quantization effects from reporting the duration in μsec), which means a large value for R3. That is limited by the problem of picking up 60Hz noise if the input impedance is too high.

We can also tweak r=R5/R4 a little, to make the period a larger multiple of τ, limited by the problem of noise if we get the thresholds too close to the rails.

Since pulseIn() only measures one part of the waveform (the low part or the high part), we could also tweak the bias voltage to lengthen just that part of the waveform, for example, dropping Vbias to Vdd/4 to length the low part.  We again have to be careful not to get the threshold too close to the rails.  If we are lowering Vbias, then the threshold to watch is . If we fix as low as we’re willing to make it, then should we make Vbias low or r high?  The number we are trying to maximize is the discharge time , with the constraint that . At equality, we have to maximize , which is achieved by making r as large as possible.  Of course, that would mean raising Vbias, which would run us into trouble with noise at the other threshold.  In general, it seems like the symmetric waveform with Vbias=Vdd/2 gives us the best noise margins.

Next step: how do we either slow down the oscillator or clean up the waveform enough to get a good signal to feed into the Arduino?

I tried increasing both R1 and R5, while decreasing R4, as shown below.

Modified circuit for longer period. C1 is just the stray capacitance of the touch sensor, with no deliberately added capacitance.

This circuit oscillates with a frequency of 35.66 kHz (period of about 28 µsec )when the touch sensor is not touched, which is slow enough that the signal runs from rail to rail. Touching the sensor drops the frequency to 20kHz or less (period of 50 µsec or more). Since r=5.556, the expected period is 4.988 τ, or 0.4988 µsec/pF C1.  The period is consistent with a stray capacitance of 56 pF, increasing to over 100 pF when the sensor is touched.  There is a lot of jitter in the lower-frequency signal, probably due to some coupling of 60 Hz noise into the system. A 1nF capacitor for C1 gives a frequency of 1660Hz (602 µsec, which is more than the expected 500 µsec), 47nF gives 34.65 Hz (28.86 msec, not the expected 23.44 msec).  Why am I consistently 25% off?

The change of 20 µsec or more in the period (10 µsec or more in the half period) should be easily detectable with one pulseIn() measurement on the Arduino.  The following code seems to work fairly well, with a light touch causing the LED to flash (right on the edge of detection) and a firmer touch giving a steady reading.

// Capacitive sensor switch
// Thu Jul 12 21:36:42 PDT 2012 Kevin Karplus

// To use, connect the output of the op-amp oscillator to
// pin CAP_PIN on the Arduino.
// The code turns on the LED on pin 13 when a touch is sensed.

// The Arduino measures the width of one LOW pulse on pin CAP_PIN.
// The LED is turned on if the pulse width is more than min_pulse_usec

// pin that oscillator output connected to
#define CAP_PIN (2)

// time (in milliseconds) to wait after a change in state before
// testing input again
#define DEBOUNCE_MSEC (100)

static uint8_t was_on;	// stored state of LED, for detecting transition

static uint16_t min_pulse_usec=5;
// min pulse width (in  microseconds) for detecting a touch

void setup(void)
{
    was_on=0;
    pinMode(CAP_PIN,INPUT);
    pinMode(13, OUTPUT);
    
    // assuming that the touch sensor is not touched when resetting, 
    // find the maximum typical value for untouched sensor
    for (uint8_t i=0; i<10; i++)
    {   long pulse=pulseIn(CAP_PIN,LOW);
        if (pulse>min_pulse_usec)
	{    min_pulse_usec =pulse;
	}
    }
    min_pulse_usec += 2;	// add some room for noise
}

void loop(void)
{
    uint8_t on = pulseIn(CAP_PIN,LOW) >= min_pulse_usec;
    digitalWrite(13, on);
    if (on!=was_on)
    {   delay(DEBOUNCE_MSEC);
        was_on=on;       
    }
}


Filed under: Circuits course Tagged: Arduino, bioengineering, capacitive touch sensor, circuits, course design, op amp, sensors, teaching

Capacitive sensing with op amps

I’m not very happy with the lab exercise in Capacitive sensing.  The basic design questions are good:

  • What capacitance do we add by touching something?
  • What frequency should the oscillator run at without the touch?
  • What % change in frequency can we detect reliably? How will we do that detection?

but I’m not happy with my choice of an LM555 chip for the oscillator.  It is a fine choice for many purposes, and a good chip for students and hobbyists to learn about, but the Fairchild Semiconductor LM 555 data sheet does not do a good job of explaining how the chip works nor exactly what the logic function is for triggering the flip-flop.  As a result, students will probably end up just copying the astable circuit without really understanding it.

I think I would prefer to have them use an op-amp multi-vibrator circuit.  It can’t quite be modeled with only linear op amps, as it relies on clipping of the output to get nearly a square wave.

Op amp multivibrator. The first op amp is just to set up a virtual ground halfway between the power rails. The second op amp does the oscillating (at about 8.12 kHz for these components). Circuit drawn with CircuitLab, which is not capable of simulating it.

The op-amp multivibrator is a simple design.  When the output is high, C1 is charged until V_minus is higher than the positive input of the op amp (about 34.7% of the way from Vbias to Vout=Vdd).  Then the output goes low (taking about 6µsec, limited by the slew rate of the op amp), and the capacitor discharges until it is below the positive input (about 65.3% of the way from Vbias to Vout=0 with these values for R4 and R5). So Vminus swings from (1-0.6526) Vbias = 0.1737 Vdd to Vbias+0.6526(Vdd-Vbias)=0.8263Vdd.  The time it takes to charge or discharge should be about 
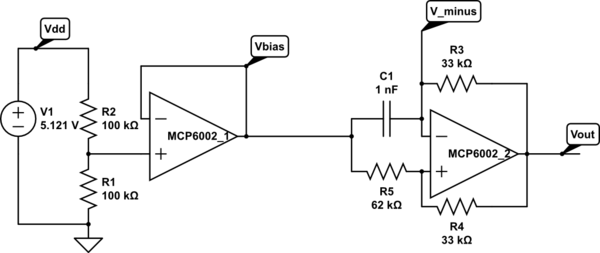
,  where the time constant τ=R3 C1.  For the values of R4 and R5 here, the charge time should be 1.560 τ, and the period 3.119 τ. With the given values of R3 and C1, this should be a period of 102.9 µsec, or a frequency of 9.7 kHz.   I’m measuring 8.1 kHz, not 9.7 kHz, but I think that the discrepancy is due to the slew rate limitations (which add about 12 µsec to the period) and possibly stray capacitance.  With C1=47 nF, the frequency is 203.6 Hz, when the calculation says it should be 206.7 Hz, well within the accuracy of the components.

Connecting the foil-and-plastic-wrap sensor to Vminus adds a little stray capacitance, dropping the frequency to 8.01 kHz. Touching the sensor drops the frequency to 7.5 kHz–7.7 kHz, adding about 5 µsec–8.5 µsec to the period, consistent with adding about 50pF – 83 pF to C1.  This is a little smaller than the 163 pF that I estimated using the parallel-plate model in Capacitive sensing, but consistent with my measurements using the LM555 circuits.

I can get a much stronger effect if I remove C1 from the circuit, and use only stray capacitance.  The period drops to about 6.2 µsec (roughly 160 kHz), but (because of the slew rate limitations of the op amp) is not full scale and is essentially a triangle wave.  Touching the sensor reduces the frequency to about 35 kHz – 45 kHZ, an increase of 16 µsec – 22 µsec in period, consistent with an additional capacitance of  155 pF – 220 pF, which is about what was predicted by the parallel plate model. I’m a little reluctant to put this signal into an Arduino board, though, as the no-touch signal spends most of its time in the non-digital region between high and low, and only barely crosses the thresholds that would allow the ATMega328 chip to detect the signal.

One interesting idea would be to take advantage of the change in amplitude of the oscillation to make an all-analog touch detector.  I’m afraid that would not be very robust, though, as an increase in the period of only 12 µsec is enough to make the oscillation full scale.


Filed under: Circuits course Tagged: Arduino, bioengineering, capacitive touch sensor, circuits, course design, LM555, op amp, sensors, teaching

Buying parts for circuits course

I’m going to need some parts to play with for the circuits course.  While I probably could get the parts I need at work from the Baskin Engineering Lab Support (BELS) staff, it would probably involve a bit of hassle, as there isn’t even a course number for the course yet, and so they’d have a difficult time figuring out which department to charge for the 30¢ and 60¢ parts—the cost in staff time (and my time) would be ridiculous.  So I decided to buy my own parts with my own money from Digikey.  My experience with them in the past is that in-stock parts generally get delivered by US mail within 2 days of ordering (it helps that they are not far away).

One experience we don’t give the students (at least, not until the senior design project) is trying to figure out what parts to buy.  It can be an overwhelming task—DigiKey has in stock 10,917 chips that come up in response to a search for op amps. We can reduce that to 1,249 if we restrict ourselves to through-hole rather than surface-mount parts. Adding a request for rail-to-rail outputs reduces that number to 314.  Sorting by price and looking through those under $1 shows many from Microchip Technology, each with slightly different specs.  I don’t see any way that a student in a beginning circuits class could make sense of most of the specs.

Thermistors are almost as bad, as there are a lot of specs for them also, and the price range is huge.  You have to know that you want NTC (negative thermal coefficient) devices, which gets you down to 1,369 thermistor types.  Eliminating surface mount parts reduces the number to 479, ranging in price from 23.5¢ each to $20 each.

I’ve decided to play with three different thermistors:

  • Vishay BC Components NTCLE100E3103JB0 a very cheap (23.5¢ each in quantities of 10) 10kΩ thermistor with B-value 3977K).  There is high variation in the resistance (±5%), but low variation in the B-value (±0.75%).  These are glass-bead thermistors with short leads and will need some sort of waterproofing for the labs.
  • The epoxy-coated Vishay BC Components NTCLE413E2103F520L has 50mm leads and is epoxy coated, but with the warning “Not intended for fluid immersed applications or continuous contact with water.”  It is a 10kΩ thermistor with B-value 3435K, both ±1%, and costs 34.9¢ each in quantities of 10. It may be waterproof enough for the relatively short duration of the labs, and the 2″ leads may make it easier to use with disposable thermometer covers from the drugstore.
  • Murata Electronics North America NXFT15XH103FA2B100 a 10kΩ thermistor with B-value 3431K, with low resistance variation (±1%) and moderate B-value variation (±1%).  Note: the specs give different B-values depending which pair of temperatures used—I’ll have to look to see if they have specs for higher-order models of the resistance as a function of temperature. Although these thermistors cost more (66¢ each in quantities of 10), they have 100mm insulated, flexible leads, which should be long enough that we use these in a coffee-cup water bath, though they come with the warning not to use them in wet or humid locations, nor “Places with salt water, oils, chemical liquids or organic solvents”.  The long flexible leads may make this one the easiest to use with disposable thermometer covers.

It looks like I’d have to go to $2–$4 per part for thermistor probes with a brass, copper, or plastic sheath, and even then the manufacturers don’t say that they are waterproof.

I also decided to get myself some op-amp chips to play with, since we will certainly be assigning some op-amp labs. Because I don’t have a bench power supply, I want to use a single power supply, like a 5v wall wart (or the 5v supply for the Arduino).  I also want a DIP package, so that I can use the op amp on a breadboard.  I looked for cheap op amps on Digikey, and the best choice I found was a Microchip Technology MCP6002-I/P (33¢ each in quantities of 10) for a dual op amp with rail-to-rail output.  It is a bit slow (1MHz gain-bandwidth product, 0.6V/µsec slew rate), but has a low input bias current (1pA) and will run on a single power supply anywhere from 1.8V to 6V, so should be easy to use with batteries or the Arduino power supply.

I will have to be careful not to blow up the chips with my function generator, though, as I believe it has a 10V peak-to-peak output.  Maybe I won’t have to worry about it—I just tried to turn on my function generator to check the output voltage, and it won’t turn on.  The fuse looks ok, but I don’t even get a power-on light, much less any signal at the output.  I don’t know whether I want to try debugging it or not, given that I don’t even have a manual for it, much less a schematic.  It worked fine the last time I turned it on, so I’ve no idea what the problem is.  I suppose I should have expected it, buying cheap, old equipment on e-bay, but I didn’t expect the function generator to fail after I had checked that it was working.  It will be harder for me to develop a lab that uses a function generator, though, if I don’t have a functional one to test the lab with.  I wonder whether it is better to try to fix the one I have or get another one.

The students will have Agilent 33120A Function/Arbitrary Waveform Generators to work with, which are very nice instruments, but out of my price range ($1300 refurbished on e-bay, $2200 MSRP).  I could get a cheap Victor VC2002 for about $130, which is about as good a price as the used stuff on e-bay.


Filed under: Circuits course Tagged: Arduino, bioengineering, circuits, course design, function generator, op amp, teaching, temperature measurement, thermistor