

What makes teaching programming difficult?
I’ve been following Garth’s CS Education Blog for a while, and his post Teaching programming is not getting easier resonated with me, particularly the lines
In programming memorization is a trivial part of the skill set needed to succeed. The primary skills needed are problem solving, strategizing, devolving problems into sub-tasks, interpreting, and general full bore head scratching. Those are an absolute bugger to teach, especially to kids that are not all that interested in learning those difficult skills.
I am not primarily teaching programming to beginners—my bioinformatics course has three programming courses as prerequisites and my applied circuits course does not require students to do any programming—but the same issues come up in all my courses.
Even after three previous programming courses, a lot of students have not had much practice at breaking a problem into subproblems or intelligent (rather than random) debugging. The block diagrams and “systems thinking” for the applied circuits class are precisely analogous to the decomposition of a software problem into modules, classes, or subroutines. Even in the senior thesis writing course that I taught for the last couple of years, a lot of the feedback is on getting students to structure their writing—to look at the thesis as having parts that communicate different information or with different audiences and getting the interfaces between the parts to work.
Almost all engineering requires similar problem-solving skills of decomposition into subproblems, designing and debugging parts independently, and debugging the interactions between parts. Teaching these skills in any context is difficult, and many teachers end up teaching special-purpose tricks that solve one type of problem but that does not help the student learn to solve novel problems.
Garth recognizes the problem in his own teaching:
I used to be a math teacher and math has somewhat the same thinking requirements and the same issues. The big difference is the kids would have 10 home work problems a night, 8 of which were very easy to do so they would do those and ignore the hard ones. The result would be an 80%. With math there are a lot of problems with incremental steps of difficulty for almost any new concept. Those students that can do the 70 or 80% in math survive just fine. In math I usually have several different teaching strategies for a concept. I have multiple “gimmicks” for devolving problems to make them easier to solve. I have other math teachers to ask for new approaches and a whole lot of cool stuff on the internet to use as resources. Programming on the other hand has diddly.
He learned some strategies for teaching math: assigning large numbers of small problems of gradually increasing difficulty, giving up on teaching most of the students to reach mastery, and providing gimmicks for students to memorize for the common problem types. These approaches have not worked for him teaching computer science—why not?
One difference is that the computer is not very forgiving of students who get things almost right—one punctuation mark wrong and the computer does the wrong thing or rejects the student’s attempt. Getting 70–80% of the way is not enough—students have to get the details right and not just the general picture.
Another difference is the one he notes: there are a lot more math teachers than CS teachers, particularly in K–12, so there is a lot more pedagogical content knowledge (knowledge of how to teach a subject) available in math. He notes that many CS teachers rely on a rather simple pedagogy:
After watching a number (3) of programming teachers teach it seems the teaching strategy is pretty consistent: show and tell and hope.
I wonder how much of the math pedagogy is really effective, though. A lot seems to be of the memorize-this-trick form, which gets students through their standardized tests, but does not develop transferable skills in problem decomposition or debugging.
The content in math and physics courses is also much more stable than in CS courses—what is taught at the high-school level has not changed much in the last century. The main differences have been a loss of some tools (slide rules and trig tables) in favor of tools that are easier to use and teach with (calculators). Having a stable subject to teach allows teachers and textbook writers to experiment with how to teach, rather than what to teach. Although a lot of pedagogical experimentation fails (and the field of education is not very good at separating the successes from the failures), there are a lot of techniques available to choose from.
CS, however, keeps changing what is considered essential for a first course. Fortran, LISP, Pascal, C, C++, Java, Python, Perl, Scratch, Processing, Alice, and other languages have all been proposed as “first” languages, and the programming language is often chosen for social rather than pedagogic reasons.
What topics are taught and in what order are often driven by the choice of language. For example, LISP makes it easier to talk about recursion early, but makes it difficult to talk about strict type checking. Java and C++ force spending a lot of time on explaining data types and data type declaration. Python allows easy handling of sets and associative maps (“dict” in Python), but makes talking about information hiding and data abstraction somewhat more difficult. Scratch allows early discussion of race conditions in parallel programs, but not of complex data structures or program syntax.
CS teachers disagree about what order is most appropriate to present the topics in—not just the week-by-week order, but even what belongs in the first year and what in the second or third year. I think that in many cases the order doesn’t matter all that much—there are several different ways to get to a similar endpoint, and different students will respond well to different approaches. In the new bioengineering curricula that I’ve proposed, different concentrations have different programming requirements, with the bioelectronics track requiring bottom-up programming that teaches low-level interfacing to microprocessors in C, and the biomolecular track starting with bioinformatics-like programming tasks in Python.
Some of the teaching practices at colleges have not been helpful for developing desired skills. For example, automated grading programs, which look just at I/O behavior of programs, are becoming more popular in huge college CS classes (and especially in MOOCs). But with automated grading students get almost no feedback on the decomposition into subproblems and clarity of documentation—those skills that are most needed for advancing in the field or transferring the learning to other domains.
I did end up teaching a tiny amount of programming in my freshman design seminar this past quarter: Arduino programming in C for gathering information from a thermistor or phototransistor and using it for simple on-off control (Twelfth day of freshman design seminar and Sixteenth day: Arduino demo). I did not spend enough time on the programming, and a lot of it was “show and tell and hope”, so I suspect that only one or two of the students can do any programming independently now, but several who were not interested in programming became more interested in learning, which is all I expected of the course. The 2-unit course is only about 1% of their undergraduate education, so I can’t expect to make huge changes in their competence.
Next year I will spend more time on programming and on physical prototyping in the freshman design course, as those are areas that the students identified as having the most effect on them. So I may get to the point in the freshman seminar where I’ll also be facing the challenges of teaching CS concepts to beginners, rather than just piquing their interest.
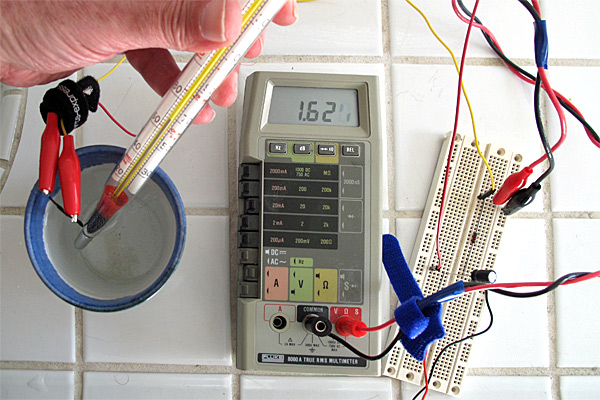
One thing I think I will do in the freshman design seminar next year is to make the students actually wire up a thermistor or phototransistor to an Arduino board early in the quarter. Having both a hardware and a software component to a design should help students learn problem decomposition and debugging, as there are obvious hardware/software boundaries—it can’t all be just one mushy “thing” in their heads.
The thermistor is particularly attractive as it requires several changes of representation—from temperature to resistance, to voltage, to ADC reading, back to a numerical representation of temperature. Since the course is intended for bioengineers, the notion of sensors and different representations of what they sense is an important concept to build on, and temperature is a concept that they are familiar enough with that they can easily check whether what they are doing is working. Note that the data representation here is not just a software concept—the main constraint on the design is the analog-to-digital interface on the Arduino, which only measures voltage between 0 and 5V.
Having a thermistor lab early also works as part of a build-a-physical-prototype theme. I’m not going to use lab fees and handing out a lab kit, either, but make them find and order their own parts. One of the problems this year was students not realizing that getting parts requires a lot of lead time—having them experience that early in the quarter will make them more diligent about getting parts in time later in the quarter. To reduce shipping costs, I may have everyone look for parts separately, but then have them pool the orders, if they can agree on which parts they want to get.
In the coming quarter, in the Applied Circuits course, I’ll be trying to work more deliberately on both systems thinking and information representation, getting the students into being explicit about both earlier in the quarter. (The first lab is a thermistor lab, which I am in the process of rewriting the lab handout for, which may be why it was the example I thought of using for the freshman design course.) I’ve heard discouraging reports about how little transfer there is of problem-solving skills between different subject domains, but I’m hopeful that having students encounter the same problem-solving concepts in several different domains will help them make the transfer.
Filed under: Circuits course, freshman design seminar Tagged: Arduino, computer science education, math education, technical writing, thermistor, writing


 curve to this data (warning: temperature needs to be on an absolute scale).
 . They would then measure and plot the voltage output for the same set of water baths. If they do it right, they should get a much more linear response than for their resistance measurements.

 curve. The report the B-value as a 2-point fit for T=25° C and T=85° C, but they also report resistance values every 5° C from –40° C to 105° C. One can compute the B-value for any pair:


 , where we are approximating
  for temperature T in Kelvin. We’d like the voltage to be as linear as possible, which means we want the second derivative of Vout with respect to T to be zero. Obviously, we can’t do that for all values of T, but we might be able to do it for a particular value of T, and to have a small second derivative in that neighborhood.

 , that is if
  .
.


 , where
  is the resistance one would get for putting the series and parallel resistors in parallel. This is exactly the same condition as before, but with
  .
. and a series resistor consisting of R1 and R2 in parallel:
  . The only reason to put in a parallel resistor would be to restrict the voltage range (which might be useful if the output were to be amplified, but is not useful if the output is going directly into an analog-to-digital converter whose full-scale range is 0 to Vdd).


 to the data, where R is the resistance in Ω and T is the temperature in degrees Kelvin. But gnuplot got as good a fit using just A and B as using the third order fit, with
  providing an excellent fit.

 , which is the equation most often used in thermistor specs, I get A=0.24Ω and B=3157°K, which is not that close to the spec (10kΩ @ 25°C, B=3435±35°K, so A=0.0992Ω). Note that the spec curve fits the data quite well for warm temperatures, but deviates badly for cold ones.


