I had a good discussion with Steve P. this afternoon about the order and purpose of the labs I’ve designed so far. He’ll be putting together a list of EE topics we have to cover to coordinate with the labs, so that students will have enough theory to do each lab, but not be overwhelmed with theory that they don’t yet have a use for.
I’ve designed the labs mainly around the interests of bioengineering majors, but I’ve tried to keep in mind other possible students, such as Digital Arts and New Media students, who would be interested in practical sensor circuits for interfacing to art projects (particularly for inputs to Arduino microprocessors).
Lab 1: thermistor
See posts
- More musings on circuits course: temperature lab
- Temperature lab, part2
- Temperature lab, part 3: voltage divider
The first lab will consist of 3 parts, all involving the use of a Vishay BC Components NTCLE413E2103F520L thermistor.
First, the students would use a bench multimeter to measure the resistance of the thermistor, dunking it in various water baths (with thermometers in them to measure the temperature). They should fit a simple  curve to this data (warning: temperature needs to be on an absolute scale).
Second, they would add a series resistor to make a voltage divider. They have to choose a value to get as large and linear a voltage response as possible at some specified “most-interesting” temperature (perhaps body temperature, perhaps room temperature, perhaps DNA melting temperature). There should probably be a pre-lab exercise where they derive the formula for maximizing  . They would then measure and plot the voltage output for the same set of water baths. If they do it right, they should get a much more linear response than for their resistance measurements.
Finally, they would hook up the voltage divider to an Arduino analog input and record a time series of a water bath cooling off (perhaps adding an ice cube to warm water to get a fast temperature change), and plot temperature as a function of time.
EE concepts needed: voltage, resistance, voltage divider, notion of a transducer.
Lab skills developed: use of multimeter for measuring resistance and voltage, use of Arduino with data-acquisition program to record a time series, fitting a model to data points, simple breadboarding.
Note: Mylène suggested that we start student familiarization with the test equipment by having them use the multimeters to measure other multimeters. What is the resistance of a multimeter that is measuring voltage? of one that is measuring current? what current or voltage is used for the resistance measurement? We might want to do this first.
Lab 2: electret microphone
See posts
- Oscilloscope practice lab
- Op-amp lab
Mylène suggested that we start oscilloscope familiarity by looking at the output of power supplies. What ripple can you see on the voltage output of a benchtop supply? of a cheap wall wart? This requires the students to learn the difference between DC and AC input coupling for oscilloscopes. I think that we may be able to teach what we need here without measuring the power supplies, though that is a good backup plan.
First, we would have the students measure and plot the DC current vs. voltage for the microphone. The microphone is normally operated with a 3V drop across it, but can stand up to 10V, so they should be able to set the Agilent E3631A power supply to various values from 0V to 10V and get the voltage and current readings directly from the bench supply, which has 4-place accuracy for both voltage and current. There is some danger of the students accidentally delivering too much voltage and frying the mic, but as long as they get the polarity right, that isn’t too big a hazard. Ideally, they should see that the current is nearly constant as voltage is varied—nothing like a resistor.
Second, we would have them do current-to-voltage conversion with a 5v power supply to get a 2.5v DC output and hook up the output of the microphone to the input of the oscilloscope. Input can be whistling, talking, iPod earpiece, … . They should learn the difference between AC coupled and DC coupled inputs to the scope, and how to set the horizontal and vertical scales of the scope.
Third, we would have them design and wire their own DC blocking filter (going down to about 1Hz), and confirm that it has a similar effect to the AC coupling on the scope.
Fourth, they should play sine waves from the function generator through a loudspeaker next to the mic, observe the voltage output with the scope, and measure the voltage with a multimeter, plotting output voltage as a function of frequency. Note: the specs for the electret mic show a fairly flat response from 50Hz to 3kHz, so most of what the students will see here is the poor response of a cheap speaker at low frequencies. Those with extra time could look at putting the speaker and mic at opposite ends of tube and seeing what difference that makes.
EE concepts: current sources, AC vs DC, DC blocking by capacitors, RC time constant, sine waves, RMS voltage, properties varying with frequency.
Lab skills: power supply, oscilloscope, function generator, RMS AC voltage measurement.
Lab 3: electrode measurements
See posts
- Trying to measure ionic current through small holes
- Conductivity of saline solution
- On stainless steel
- Better measurement of conductivity of saline solution
- Measuring Ag/AgCl electrodes
First, we would have the students attempt to measure the resistance of a saline solution using a pair of stainless steel electrodes and a multimeter. This should fail, as the multimeter gradually charges the capacitance of the electrode/electrolyte interface. For the safety of the lab equipment, we should have the beakers with salt water in a secondary containment tray at all times.
Second, the students should again use a voltage divider, with 10–100Ω load resistor, but with the function generator driving the voltage divider. The students should measure the RMS voltage across the resistor and across the electrodes for different frequencies from 3Hz to 300kHz (the range of the AC measurements for the Agilent 34401A Multimeter). They should plot the magnitude of the impedance of the electrodes as a function of frequency and fit an R2+(R1||C1) model to the data. A little hand tweaking of parameters should help them understand what each parameter changes about the curve.
Third, the students should repeat the measurements and fits for different concentrations of NaCl (we’ll have to get a liter or so of each stock solution made up by one of the wet labs). Seeing what parameters change a lot and what parameters change only slightly should help them understand the physical basis for the electrical model.
Fourth, students should make Ag/AgCl electrodes from fine silver wire. To avoid possible problems with Clorox in the lab, we’ll probably have them electroplate in NaCl solutions. If their electrodes have an area of about 0.8 cm2 (2.5cm of 18 gauge wire with a diameter of 1.024mm), we can electroplate at the recommended current density of 1mA/cm2 (so 0.8mA) in 0.9% (0.16M) NaCl for a minute, reversing polarity occasionally to improve the chloride coat. The instructions I’ve seen vary a lot, so neither the salt concentration nor the current density seem to be particularly critical values. We could provide a constant-current supply, but we can probably get by with just having them use a bench supply and adjust the voltage manually to keep the current around 1mA, using visual feedback to terminate the process. (Some instructions just call for using a 9v battery and a whole coil of silver wire.) According to Warner Instruments
The color of a well plated electrode will be light gray to a purplish gray. While plating, occasionally reversing the polarity for several seconds tends to deepen the chloride coating and yield a more stable electrode.
Fifth, the students should measure and plot the resistance of a pair of Ag/AgCl electrodes as a function of frequency (as with the stainless steel electrodes). We’ll have to think of an easy way for them to mount their electrodes so that they don’t move and so that the silver-copper interface is not near the salt water.
Sixth, if there is time, measuring the potential between a stainless steel electrode and an Ag/AgCl electrode.
EE concepts: impedance, series and parallel circuits, variation of parameters with frequency.
Electrochemistry concepts: At least a vague understanding of half-cell potentials. Ag → Ag+ + e-, Ag+ + Cl- → AgCl.
Lab skills: bench power supply, function generator, multimeter, fitting functions of complex numbers, handling liquids in proximity of electronic equipment.
Lab 4: Sampling and aliasing
I don’t know the details of this lab, but Steve P. has a PC board that samples and digitizes an input with an 8-bit ADC, then reconstructs the waveform with a DAC. He has worked out a lab for explaining and demonstrating aliasing of sampled signals using this board, a signal generator, and a dual-trace oscilloscope. I’ll have to borrow the board and the lab handout from him to see if there is anything in the lab I’d want to tweak.
EE concepts: quantized time, quantized voltage, sampling frequency, Nyquist frequency, aliasing.
Lab skills: dual traces on oscilloscope.
Lab 5: Op amp basics
See post Op-amp lab
Use an op amp to build a simple non-inverting audio amplifier for an electret microphone, setting the gain to around 6 or 7. Note that we are using single-power-supply op amps.
If this lab is too short, then students could feed the output of the amplifier into an analog input of the Arduino and record the waveform at the highest sampling rate they can with the software we provide (probably around 300–500 Hz). This would again demonstrate aliasing.
EE concepts: op amp, DC bias, bias source with unity-gain amplifier, AC coupling, gain computation.
Lab skills: complicated breadboarding (enough wires to have problems with messy wiring). If we add the Arduino recording, we could get into interesting problems with buffer overrun if their sampling rate is higher than the Arduino’s USB link can handle.
Lab 6: capacitive touch sensor
See posts
- Capacitive sensing
- Capacitive sensing, part 2
- Capacitive sensing with op amps
- Capacitive sensing with op amps, continued
The students would build an op-amp oscillator (a square-wave one, not a sine wave) whose frequency is dependent on the parasitic capacitance of a touch plate, which the students can make from Al foil and plastic food wrap. Students would have to measure the frequency of the oscillator with and without the plate being touched.
We can provide a simple Arduino program that is sensitive to changes in the period of the oscillator (see example in Capacitive sensing with op amps, continued) and turns an LED on or off.
EE concepts: frequency-dependent feedback, oscillator, RC time constants, parallel capacitors.
Lab skills: more messy breadboarding. Frequency measurement.
Lab 7: Phototransistor
See posts
- Phototransistor
- Synchronous demodulator
- Pulse detection with light
- Giving up on light-based pulse sensor
- Looking at bioengineering measurements courses
- Random thoughts on circuits labs
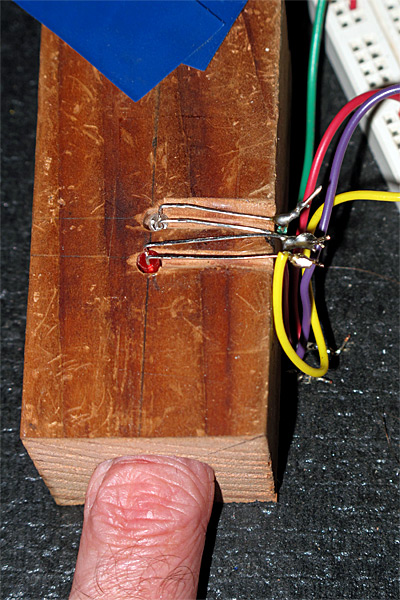
Since optical detection is such an important part of many biomolecular lab techniques, I really want to do something with an LED and phototransistor (or CdS cell or photodiode), but so far none of my ideas have worked out. I have a nice Fairchild QRE1113 reflectance sensor that uses a matched 940nm wavelength LED and phototransistor, which I’ve used a tachometer for motors for the robotics club. Unfortunately, a tachometer is more appropriate for a mechatronics lab than a biengineering circuits course.
I thought that I might be able to use it to measure arterial pulses by reflection, but I don’t seem to get a signal at my heart rate (I did better with the uncomfortable ear clip).
The reflectance sensor is good for measuring finger tremor if you hold a finger close to (but not touching) the sensor. The effect is optical, not capacitive coupling, since the signal is stronger if a non-conducting white piece of paper is held near the sensor rather than a finger. The reflectance sensor is remarkably insensitive to ambient light, though shining a laser pointer on the sensor is easily detected.
We can easily do labs involving interrupting light beams, but there isn’t much “circuit” stuff for the simple ones and not much “bio” stuff either. We could up the circuit content (perhaps too much) by modulating the light beam and using a synchronous demodulator to detect the beam even in the presence of high ambient light.
I still need to find something that is feasible and somehow related to bioengineering. This needs more thought.
Lab 8: No idea
I’m still missing a lab. I’ve not done anything with position, pressure, or volume sensing yet. Of course, it is possible that some of the earlier labs will take longer than I think, and we’ll need to slip the schedule anyway. The EKG lab looks pretty packed, so may be some portion of that could be foreshadowed here. Perhaps bandpass filtering and characterizing a simple filter? That would be useful, but rather boring.
Maybe an electronic music lab of some sort would be fun here?
Labs 9 and 10: EKG
See posts
- EMG and EKG works
- Two-stage EKG
- EKG recording working
- More thoughts on EKG
- EKG blinky
- Instrumentation amp protoboard
- Instrumentation amp protoboard rev2.1
- EKG blinky boards arrived
The electrocardiogram will be the final project for the course, and I think it will take two full lab sessions. The first lab session would consist of soldering up the instrumentation amp protoboard, checking for opens and shorts, and designing and characterizing a differential amplifier with an adjustable gain of about 100–1000 (including AC coupling to eliminate problems with DC offset saturating later stages). The amplifier should have a bandwidth of about 0.01Hz–150Hz.
The second one would be and making a twisted-wire harness with alligator clips to attach to the EKG electrodes, connecting the amplifier to the electrodes, debugging the student-designed EKG amplifiers, and adjusting the gain. I suspect that a few students will get a design that works in the first week, but that a lot of students will be doing a lot of unsoldering and resoldering as they find bugs in their design, hence the need for 2 weeks in the lab.
Student check out will require that they be able to blink an LED in time with their heart beat, display the EKG waveform on the oscilloscope, and record a minute of EKG signal at 200 samples/second using the Arduino, all without adjusting their board between demos.
EE concepts: biopotentials, instrumentation amplifier, common-mode signal, differential signal, twisted pair wiring, grounding to avoid common-mode signal saturating an instrumentation amplifier, Ac coupling, simple bandpass filtering.
Lab skills: soldering.
Summary
I have a pretty clear idea how I think the lab part of the course should start and how it should end, but there are a couple of weeks just before the end that are still a bit vague. Perhaps as Steve starts aligning the EE topics with the labs he can identify some topics that need a lab exercise to clarify them. Maybe some of my blog readers (those who haven’t deserted me during this long process of designing a course) can make some more suggestions—even repeating some old suggestions would not be a bad idea now, as I need a creative kick.
Filed under:
Circuits course,
Data acquisition Tagged:
Arduino,
bioengineering,
capacitive touch sensor,
circuits,
course design,
ECG,
EKG,
electret mic,
electret microphone,
electrocardiogram,
electrodes,
electronics,
multimeter,
op amp,
oscilloscope,
phototransistor,
sensors,
teaching,
thermistor 


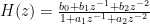
 , where
  . Note that the z values that correspond to sinusoids are along the unit circle, from DC at
  up to the Nyquist frequency
  at
at  .
.
 , and b0=1, b1=0, and b2=–1. The other two parameters it gave me were a2=0.4327386423 and a1=–1.3802466192. Of course, I don’t want to use floating-point arithmetic, but small integer arithmetic, so that the only division I do is by powers of 2 (which the compiler turns into a quick shift operation).


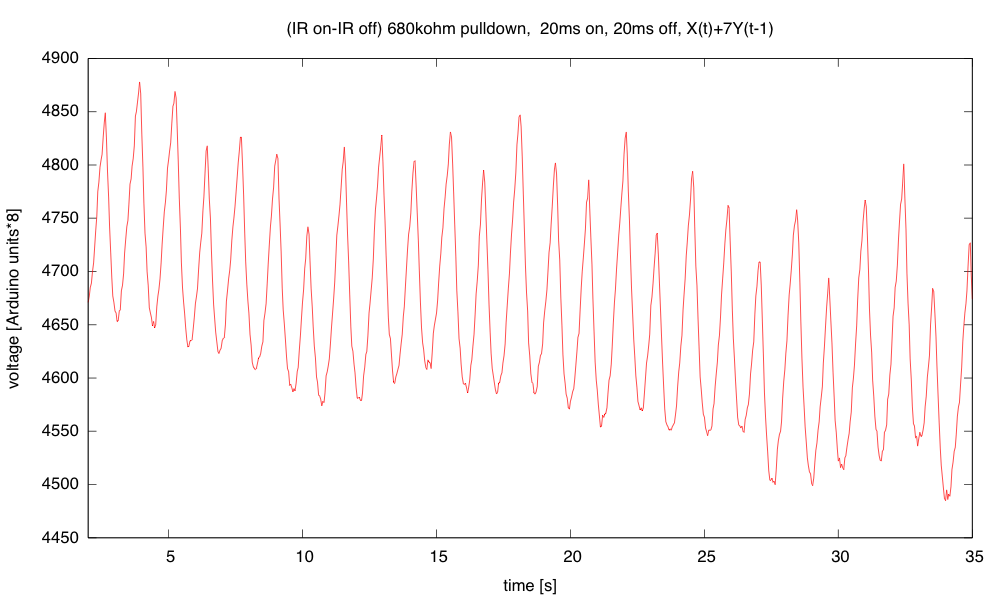
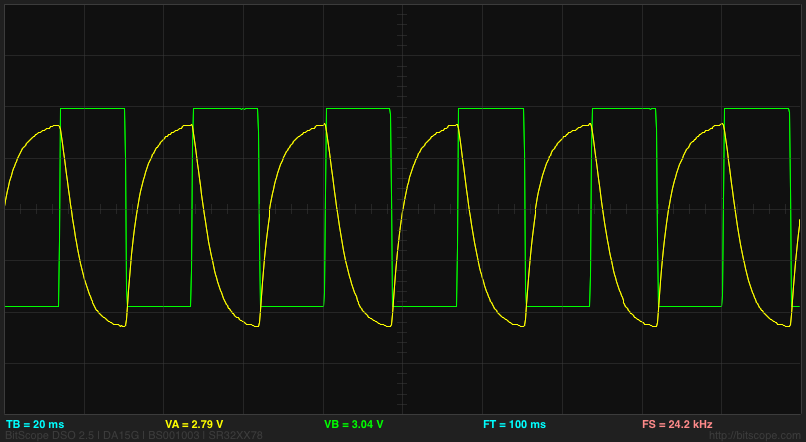
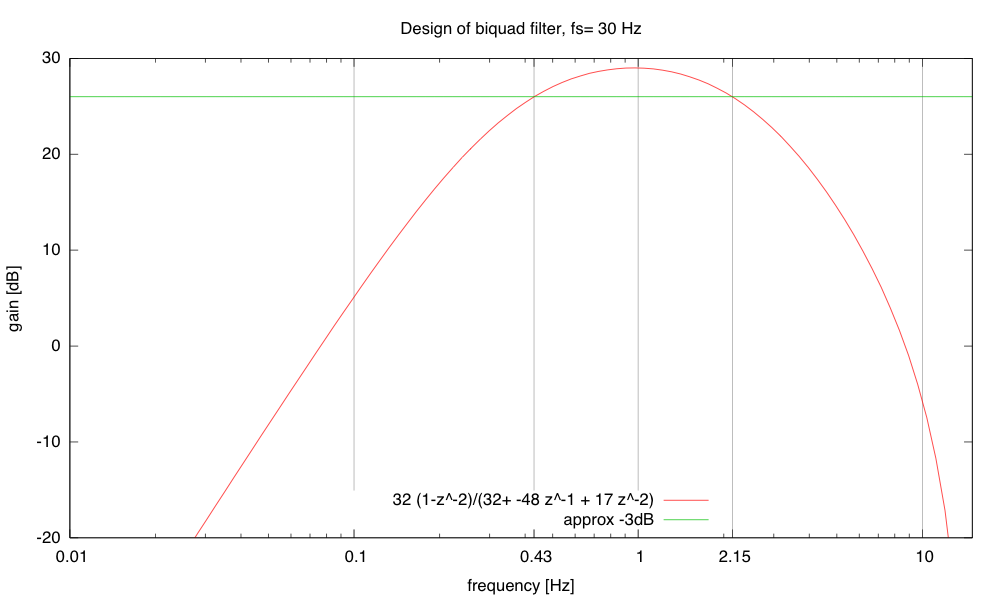
 . Because division is very slow on the Arduino, I limited myself to simple shifts for division: a= 1/2, 1/4, or 1/8. To avoid losing even more precision, I actually output
  then divided by 8 to get Y(t). I also used a 40msec sampling period, with the IR emitter on for 20ms, then off for 20msec (the waveform shown in the oscilloscope trace above).


