

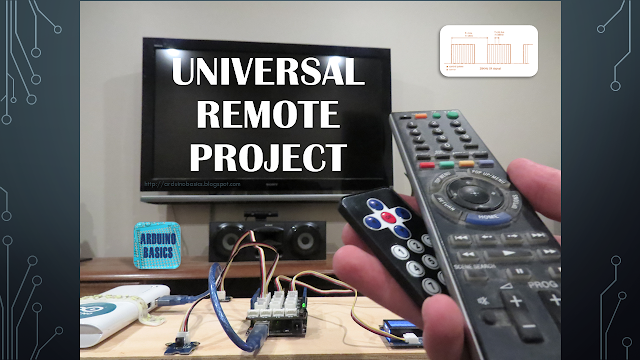
Universal Remote a Grove Infrared project
Description
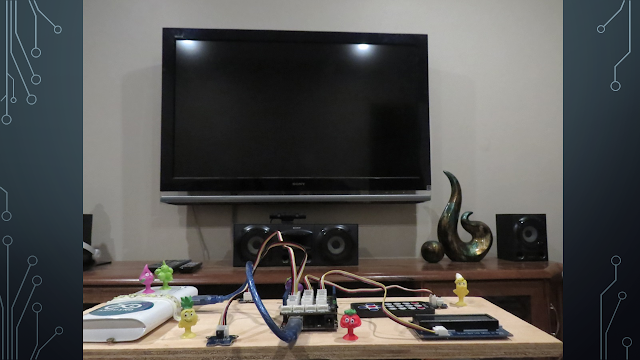
into a programmable universal remote.
A single button press on the Keyes remote will be converted into precise Sony IR signal combinations using an Arduino UNO and an assortment of Seeedstudio Grove modules.
You can assign signal combinations from more than one remote if desired.
An example combination could be to:
- Turn on the TV and then switch channels.
- Turn on the TV, sound system, and air-conditioner.
- Turn up the volume x 3.
Parts Required
- Arduino Uno (or compatible board)
- Grove Base Shield (v2)
- Grove Infrared Receiver
- Grove Infrared Emitter
- Grove Button
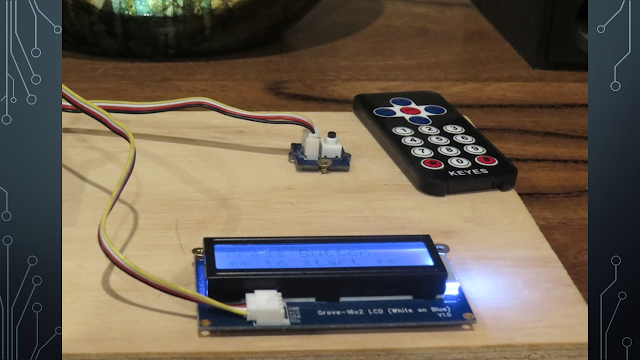
- Grove 16x2 LCD (White on Blue)
- Grove Universal 4 pin buckled cable: one supplied with each module.
- KEYES IR Remote Control
- SONY IR remote control
- USB cable - to power and program the Arduino
- Battery pack / Power bank

More information about the Grove modules can be found here:
**Please Note: The Grove Base shield has 14 pins on the Analog side, and 18 pins on the digital side. Check the number of pins on your Arduino UNO (or compatible board) to ensure the shield will sit nicely on top. NOT compatible with Arduino boards that have the Arduino Duemilanove pin header layout.Arduino IDE
While there are many Arduino IDE alternatives out there, I would recommend that you use the official Arduino IDE for this project. I used the official Arduino IDE app (v1.8.5) for Windows 10.
Make sure to get the most up-to-date version for your operating system here.

Libraries required
The following libraries will be used in the Arduino code:
- Wire Library
- IRLib2 Library
- rgb_lcd Library
Wire Library
The Wire library is used for I2C communication for the Grove LCD screen and is built into the Arduino IDE - no additional download required for this library.IRLib2 Library
The IRLib2 Library is actually a "set" of IR libraries, which can be downloaded from GitHub - here. In this project, I will be transmitting and receiving NEC and Sony IR remote signals.The required libraries (within the set) will be:
- IRLibRecv.h
- IRLibDecodeBase.h
- IRLibSendBase.h
- IRLib_P01_NEC.h
- IRLib_P02_Sony.h
- IRLibCombo.h
rgb_lcd Library
The rgb_lcd.h library simplifies the operation of the LCD screen.Download the rgb_lcd.h library from GitHub. Install the rgb_lcd.h library ZIP file into the Arduino IDE:
- Load the Arduino IDE
- Navigate to Sketch >Include library > Add .ZIP library...
- Select the downloaded zip file from GitHub, and press the "Open" button
- Check that it installed correctly by navigating to File > Examples > Grove-LCD RGB Backlight
Arduino Code
It is always best to upload the Arduino code to the board before you make any of the connections. This way you prevent the Arduino from sending current to a component accidentally. The code is available on my GitHub repository. Or you can have a look below. This code was written for an Arduino UNO, and may need to be modified if you are using a different board.
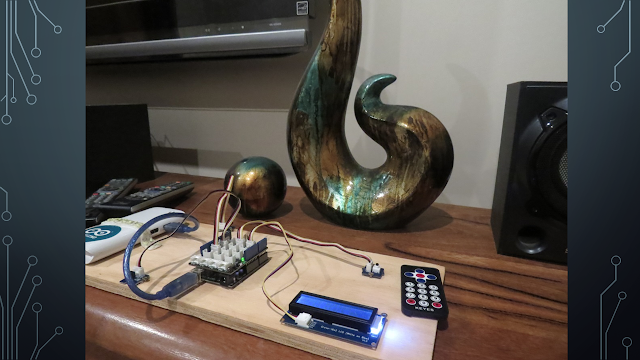
Connection instructions
If you are using the Grove Base Shield (v2). The connections are extremely simple. Use the following table as a guide. Please note that the code above assumes the following connections.

As per the table above, you would use a Grove universal 4-pin buckled cable and connect one side to D2 on the Grove base shield, and the other side would connect to the Grove Infrared Emitter.
D3 on the base shield would connect to the Grove Infrared Receiver, and so on.
You can connect the 16x2 LCD module to ANY of the four I2C connectors on the Grove base shield.
If you do not have a Grove Base shield, you have the option to use female-to-male jumper wires (together with a breadboard). But it is easier just to get the base shield and use the universal connectors.

Project Explained
When you apply power to the Arduino, the first thing that appears on the LCD screen is:

After pressing the Grove button (connected to D5), it displays the following message:

This is the cue to press and send a signal from the Keyes remote to the Infrared receiver (which is connected to D2). The Arduino will decode the Keyes remote signal, store the value in an array, and display the signal briefly on the LCD. The LCD should now show a message:
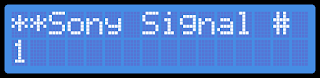
This message is a cue to press and send the FIRST signal from the Sony remote to the Infrared receiver. The Arduino will decode and store the Sony remote signal in a different array, and display it briefly on the LCD. You have the option to send a maximum of THREE Sony signal combinations to the Infrared receiver at this step in the process. The minimum number of Sony signals you can send is zero. The way to tell the Arduino that you do not want to send any further Sony signals to the receiver in this step, is by pressing the Grove Button (connected to D5).
The Arduino is programmed to receive a total of 5 Keyes signals, and each signal can be paired with a maximum of 3 Sony signal combinations. Once you have recorded all of the signal combinations, you will get a message:

The Arduino will now enter the final "Universal remote mode". In this mode, it will listen out for ANY of the 5 Keyes IR remote signals recorded previously, and will send the associated Sony signal combination in return. For example, if you press the number 1 on the Keyes remote, you could potentially have it so that the Arduino will transmit a Sony signal combination to turn on the TV and jump to a specific channnel.
The LCD will display each of the signals being transmitted. You will know you are in "Universal remote" mode because the LCD will display:

While you may be tempted to throw your Sony remote away at this stage (because you no longer have a use for it)... I would hold on to it just in case. The signals are not stored permanently. They disappear when the Arduino is powered off. But it doesn't have to be that way. You can easily modify the code to store it in eeprom memory or something.
That is not the only thing you can change.Technically, you could record the signal for any remote, however, you may need to include additional libraries or code to accommodate the alternate remote symbology. You can also modify the text messages on the LCD screen to make more sense to you. The LCD can only display 16 characters per row. So keep that it mind, when you come up with creative captions.
I would also like to mention the reason I chose not to use Seeedstudio's IR library, was because it took up too much memory. Their library probably accommodates for a wide range of symbologies. I chose the IRLib2 Library because I could select only the symbologies that I used (Sony and NEC). Thereby reducing the total amount of memory necessary to run the project. In fact, I have been finding that many of Seeedstudio's libraries to be very memory hungry. I originally wanted to create a gesture controlled remote. But the library combinations eliminated that possibility due to the cumulative memory requirements.
Conclusion
The IRLib2 library is the key to the success of this project. Without that library, this project would have been ten times harder. I was quite amazed by the effectiveness of this record / playback technique. It felt very weird to be operating my SONY TV with a cheap and nasty Keyes remote. It was quite surreal. While I chose to control my TV in this way, I could have just as easily recorded signals from one of my other remotes that use infrared signals. As more and more devices become controllable by remotes, the more I will consider turning this project into a permanent fixture in my house. A gesture controlled remote would have been nice, however, it looks like I will have to find some other use for that module now.
If you found this tutorial helpful, please consider supporting me by buying me a virtual coffee/beer.
Social Media
You can find me on various social networks:
Follow me on Twitter: ScottC @ArduinoBasics.
I can also be found on Instagram, Pinterest, and YouTube.
And if all else fails, I have a server on Discord.


 , where
  . Note that the z values that correspond to sinusoids are along the unit circle, from DC at
  up to the Nyquist frequency
  at
at  .
.
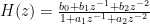
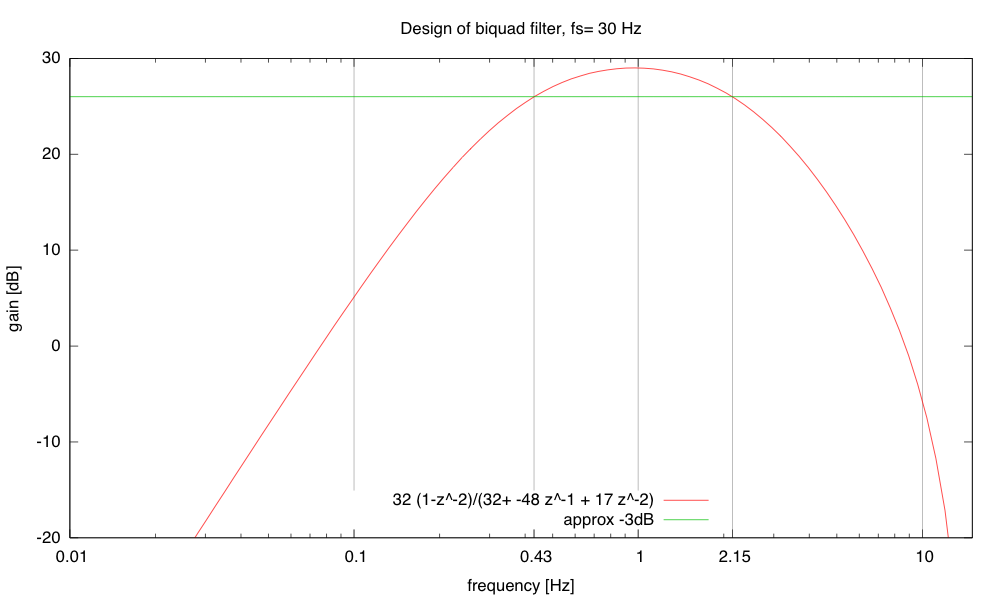
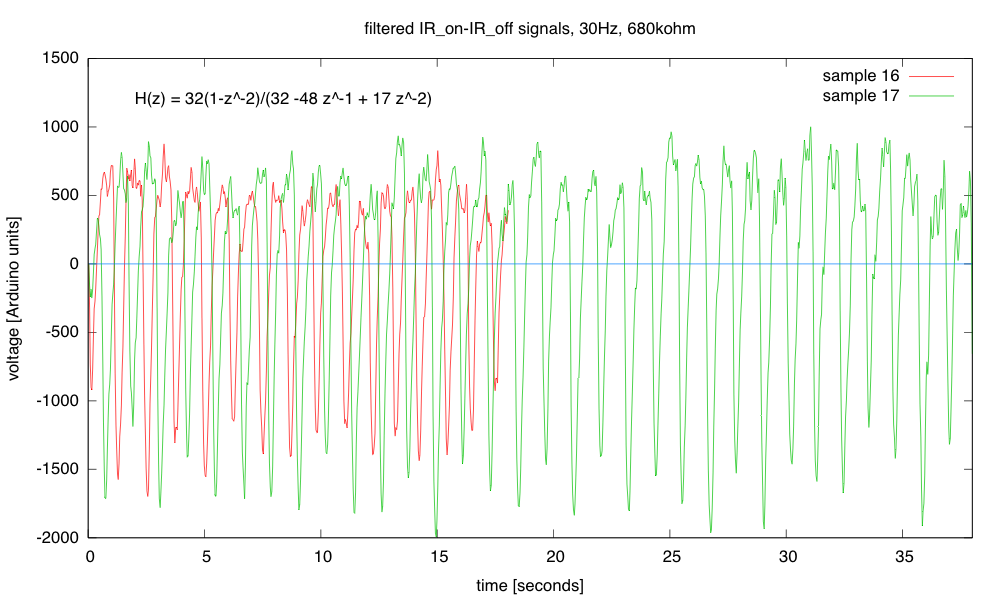
 , and b0=1, b1=0, and b2=–1. The other two parameters it gave me were a2=0.4327386423 and a1=–1.3802466192. Of course, I don’t want to use floating-point arithmetic, but small integer arithmetic, so that the only division I do is by powers of 2 (which the compiler turns into a quick shift operation).


 , where
  . Note that the z values that correspond to sinusoids are along the unit circle, from DC at
  up to the Nyquist frequency
  at
at  .
.
 , and b0=1, b1=0, and b2=–1. The other two parameters it gave me were a2=0.4327386423 and a1=–1.3802466192. Of course, I don’t want to use floating-point arithmetic, but small integer arithmetic, so that the only division I do is by powers of 2 (which the compiler turns into a quick shift operation).


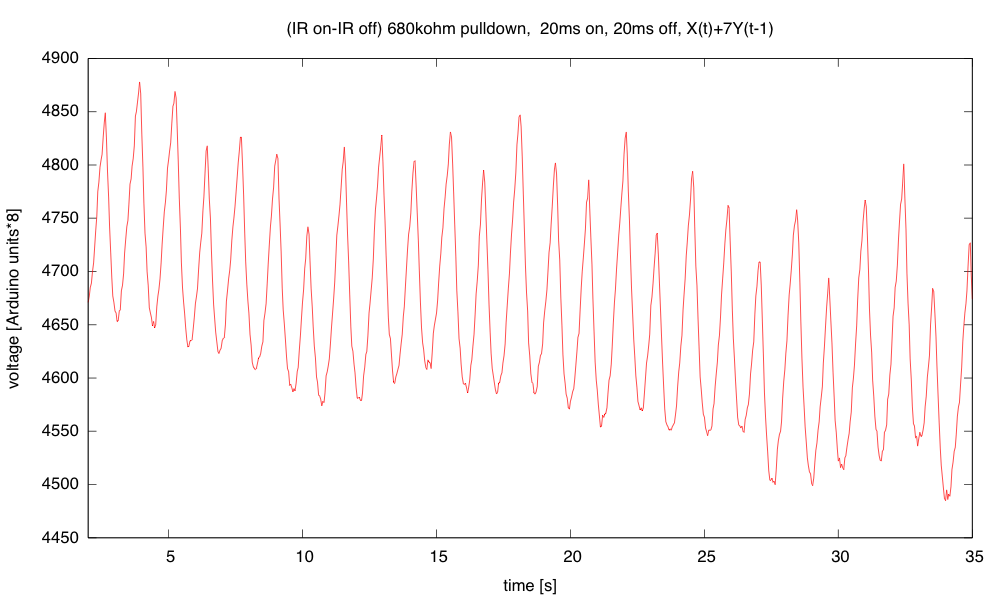
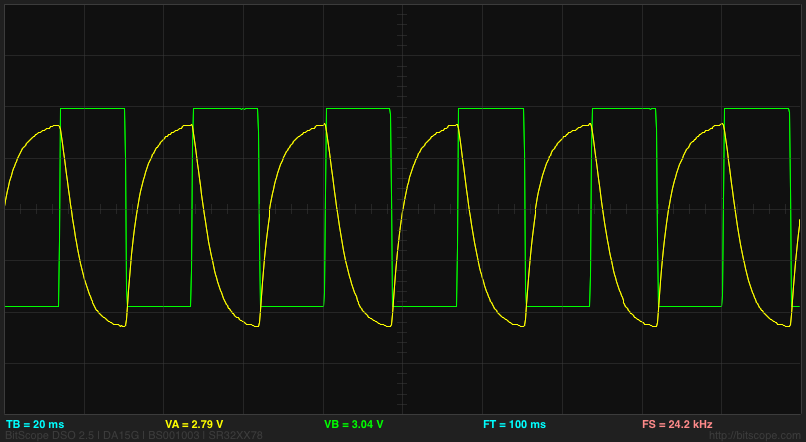
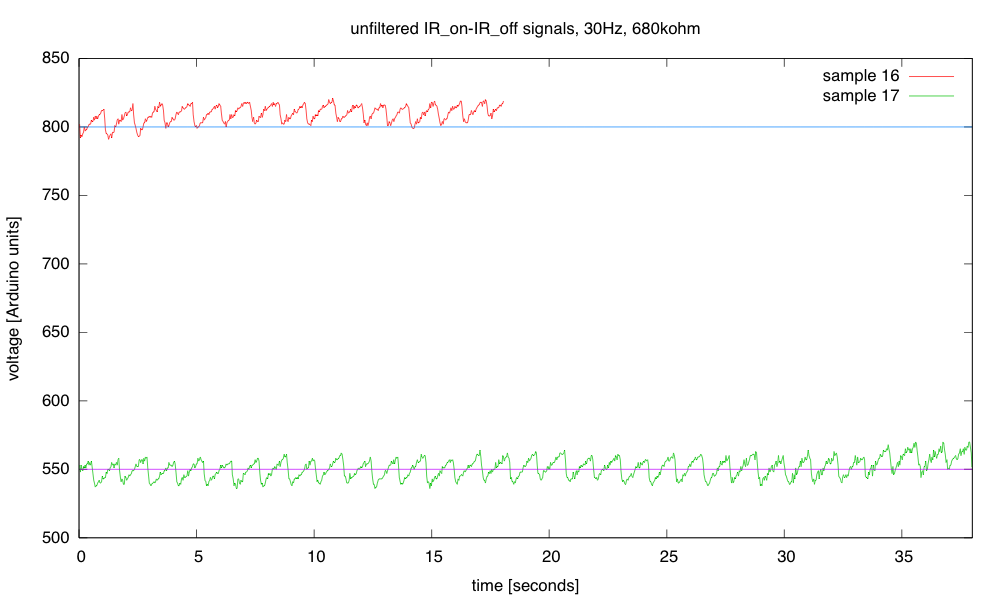
 . Because division is very slow on the Arduino, I limited myself to simple shifts for division: a= 1/2, 1/4, or 1/8. To avoid losing even more precision, I actually output
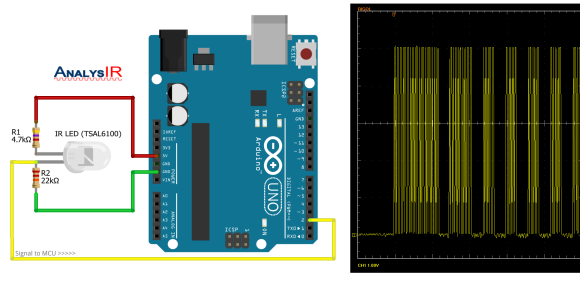
  then divided by 8 to get Y(t). I also used a 40msec sampling period, with the IR emitter on for 20ms, then off for 20msec (the waveform shown in the oscilloscope trace above).


 . Because division is very slow on the Arduino, I limited myself to simple shifts for division: a= 1/2, 1/4, or 1/8. To avoid losing even more precision, I actually output
  then divided by 8 to get Y(t). I also used a 40msec sampling period, with the IR emitter on for 20ms, then off for 20msec (the waveform shown in the oscilloscope trace above).
