

Digging into an ATtiny Simulator Bug with GDB
Being able to track down a bug in a mountain of source code is a skill in its own right, and it’s a hard skill to learn from a book or online tutorial. Besides the trial-by-fire of learning while debugging your own project, the next best thing is to observe someone else’s process. [Uri Shaked] has given us a great opportunity to brush up on our debugging skills, as he demonstrates how to track down and squish a bug in the Wokwi Arduino simulator.
A user was kind enough to report the bug and include the offending Arduino sketch. [Uri]’s first step was to reduce the sketch to the smallest possible program that would still produce the bug.
Once a minimal program had been produced, it was time to check whether the problem was in one of the Arduino libraries or in the Wokwi simulator. [Uri] compiled the sketch, loaded it onto a ATtiny85, and compared the behavior of the simulator and the real thing. It turns out the code ran just fine on a physical ATtiny, so the problem must have been in the Arduino simulator itself.
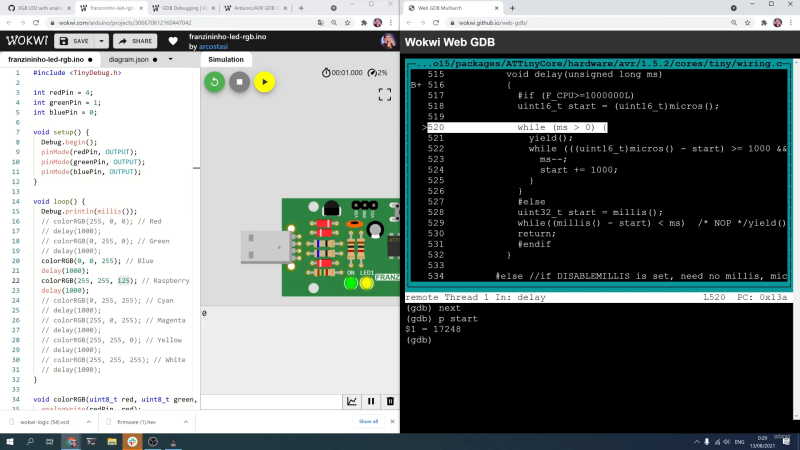
To track down the bug in the simulator, [Uri] decided to break out the big gun—GDB. What follows is an excellent demonstration of how to use GDB to isolate a problem by examining the source code and using breakpoints and print statements. In the end, [Uri] managed to isolate the problem to a mis-placed bit in the simulation of the timer/counter interrupt flag register.
If you’d like to see more of [Uri]’s debugging prowess, check out his dive into an ATtiny’s write protection and configuration fuses. If you’ve been wowed by the power of GDB and want to learn more, check out this quick tutorial!


