Yesterday, my son was thinking of adding a microphone to the design he is working on, and was considering adding a fast Fourier transform (FFT) to detect pitch.
He spent a few hours after his 10 a.m.–5 p.m. theater class reading about the FFT algorithm. He found an implementation of the FFT for an Arduino, which he tried reading along with the FFT explanations he found on the web. I’m actually surprised the the Arduino was capable of doing an FFT, given the slowness of the processor. It is true that the example code only does a 64-sample FFT with a sampling rate of 1kHz, using 8-bit samples and 16-bit integer arithmetic, but it is reported to do it at better than 10 FFTs per second.
I also pointed him to the Discrete Cosine Transform (DCT), which has somewhat smaller boundary artifacts, and can be computed about twice as fast, but he hasn’t had time to read that yet. Somewhat surprisingly the DCT article in Wikipedia much better written than the general one on Fourier Transforms, which uses awkward notation and a rather dry, formal factoid dump.
I wanted to show him that FFT did not make pitch extraction trivial (at least not in real musical contexts), so I wired up a microphone and amplifier to my BitScope Pocket Analyzer and we turned on some Internet radio (our local public radio station, KUSP). The complex mass of rapidly shifting peaks in the FFT made it clear that tracking a pitch would not be easy. (I think that there are some useful pitch-extraction algorithms that are based on FFT, but they are not trivial.) I think I convinced him that he is better off trying to extract loudness than pitch, if he wants a useful control parameter for his device.
Incidentally, he spent some time yesterday looking for cheap electret microphones. There are quite a few on the market, but many of them say “hand solder only” on the datasheets—even some of the ones with just solder pads! There are mics that can be reflow soldered, but finding prices for them in the 100s is difficult—they mostly seem to be quotes from the manufacturers only. One promising one is the SiSonic SPQ2410HR5H-PD, which is only 3.76mm by 2.24mm and uses a ball grid array (it costs 92¢ in 100s, substantially more than 57¢ for the cheapest through-hole mic (though that needs to be hand soldered). CORRECTION 2013 July 10—that’s a MEMS silicon mic, not an electret.
We looked at digital mics that do the A-to-D conversion already, but the only one with a useful output format was the ADMP441, which costs $4.52 in 100s (way too expensive). The cheaper (down to about $1.02) digital mics all use PDM (pulse-density modulation), but to get that into a usable form inside the ATMega, he’d have to low-pass filter it and pass it through the A/D converter. Still, that may not be any more expensive than an analog mic, DC-blocking high-pass filter, and amplifier, though using a separate amplifier would let him design for the proper microphone sensitivity. He’s going to have to figure out whether the board area and parts cost are worth the extra functionality of the microphone. If the board area is not a problem, he could design the mic in, but then have the devices only partially populated to save parts costs, if necessary.
We also noticed that we could tell the bandwidth of the radio station we were listening to, because there was a very clear drop in the spectrum at 10kHz. I tried capturing that this afternoon, but the station we listened to had a talk program rather than a music program, and I never captured a moment when they were using the full bandwidth. I tried a different Internet music source, and got the following plot, which seemed to indicate a 12kHz bandwidth, but that may have been limited by the music recording they were playing, rather than the codec used for transmission over the internet.
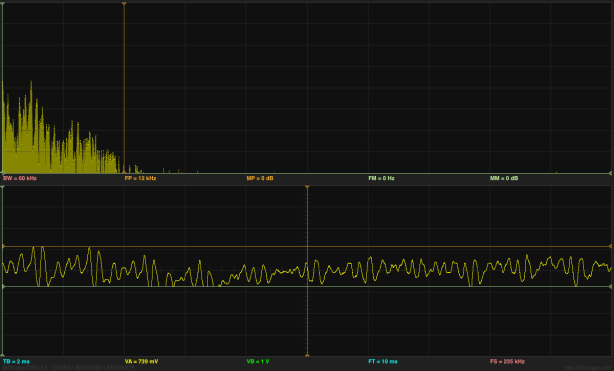
Snapshot of FFT showing a bandwidth of about 12kHz. The grid for the spectrum is 10dB per division vertically and 6kHz per division horizontally.
Before we’d played with sound input, we’d looked at sine waves generated by the BitScope, by connecting a wire from the GEN output to the CHA input. I don’t think I was able to explain to him why the windowing function used for removing boundary artifacts in the FFT results in spreading the single-frequency spikes into wider peaks. It was too late at night to go into the theory of transforms and how multiplication in the time domain turns into convolution in the frequency domain, and vice versa. For that matter, he hasn’t even had convolution yet, so some of the fundamentals needed for the explanation were missing.
At one point I thought that the FFT on the Bitscope was a crude rectangular window, but I was informed by the Bitscope people that they use a Kaiser window. I should have been able to tell that they were doing some sort of windowing by seeing the spread of the spikes for sine waves, but I wouldn’t have been able to guess which window. (It may be buried in the documentation somewhere.) Actually, now that I look at the spikes, they seem too wide for a Kaiser window, unless they set the α parameter much too large. They only need the sidelobes to be about 60dB down, which should be a much narrower main lobe—not the 18-bin width I think I’m seeing. Perhaps there is something else spreading the peaks, not just the Kaiser window.

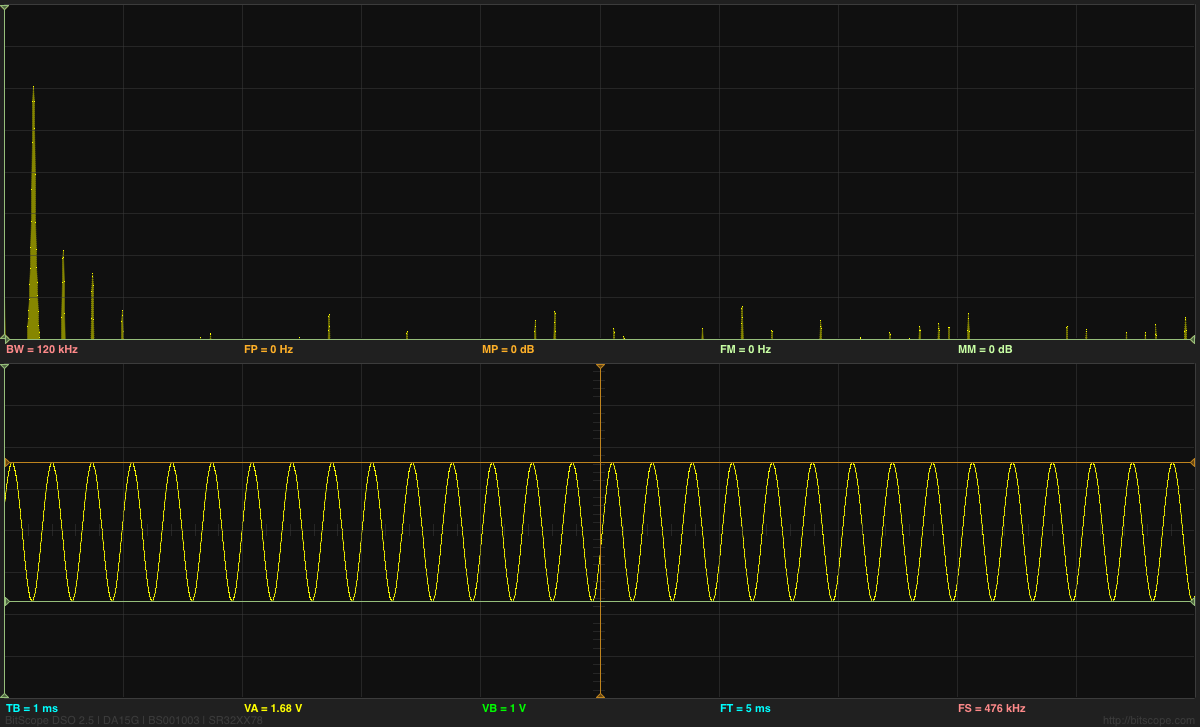
Sine wave and FFT analysis of it (Click on image for larger, clearer picture). Note the harmonic distortion (2nd, 3rd, and 4th harmonic at about –40dB, –45dB, and —53dB).
Good luck figuring out the settings of the Bitscope from the information they show on the display! TB is the time per division on the x-axis of the plot, while BW=120kHz is the full width of the spectrum (so 12kHz per division), and the sine wave is at about 3kHz.
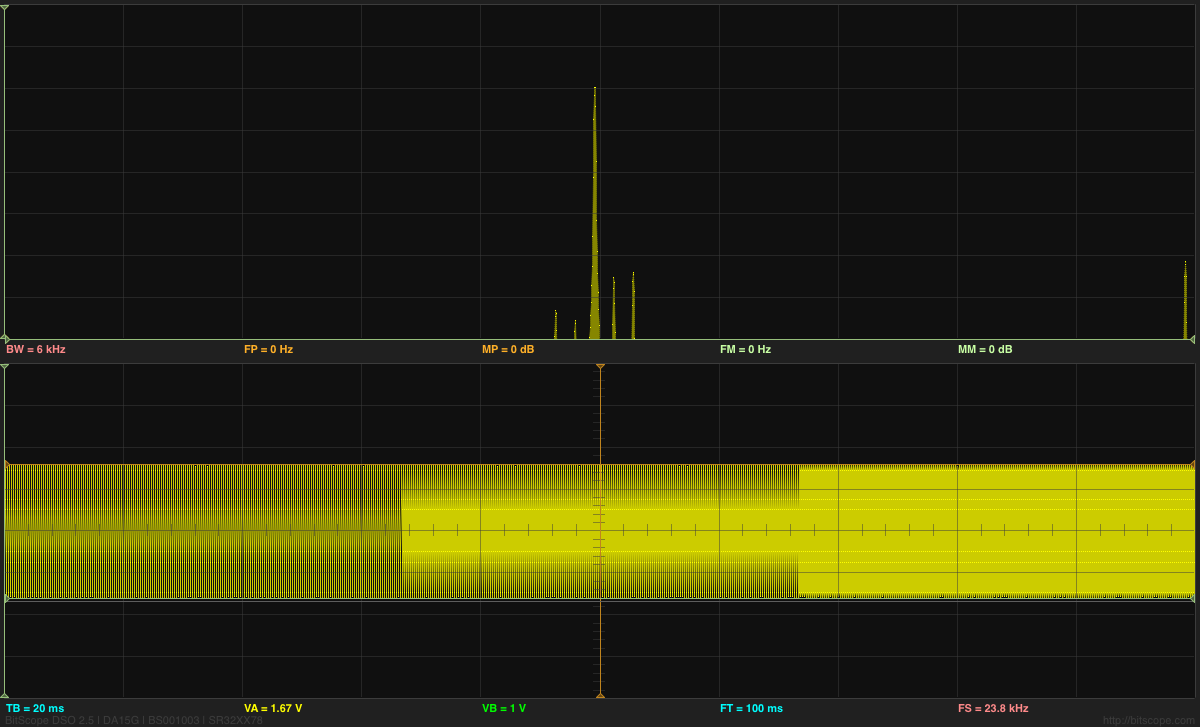
It is interesting to look a a sine wave that is an exact submultiple of the sampling frequency:

Here is a 2975Hz sine wave, where each period should be 8 samples long. Note the appearance of side bands to either side of the main peak. These artifacts are much smaller if we move to a frequency that does not fit so neatly into the FFT buffer.
Note that the time base is different for this screenshot (20ms/division).
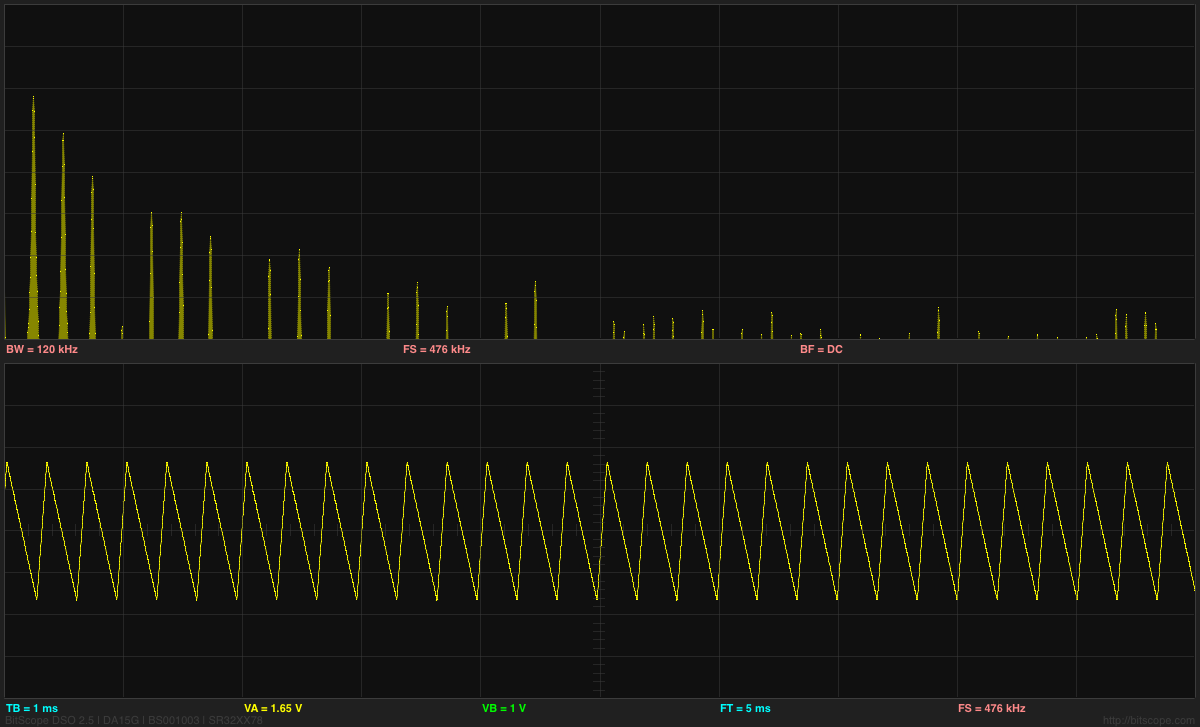
We also looked at the spectra of triangle waves and square waves (since the BitScope waveform generator can do those also). Playing with the duty cycle was fun also. I had not been aware that a duty cycle of 1/n on a square wave or triangle wave suppressed the nth, 2nth, 3nth, … harmonics. I had known that a 50% duty cycle square wave or triangle wave suppressed the even harmonics, but I had never thought about other duty cycles.
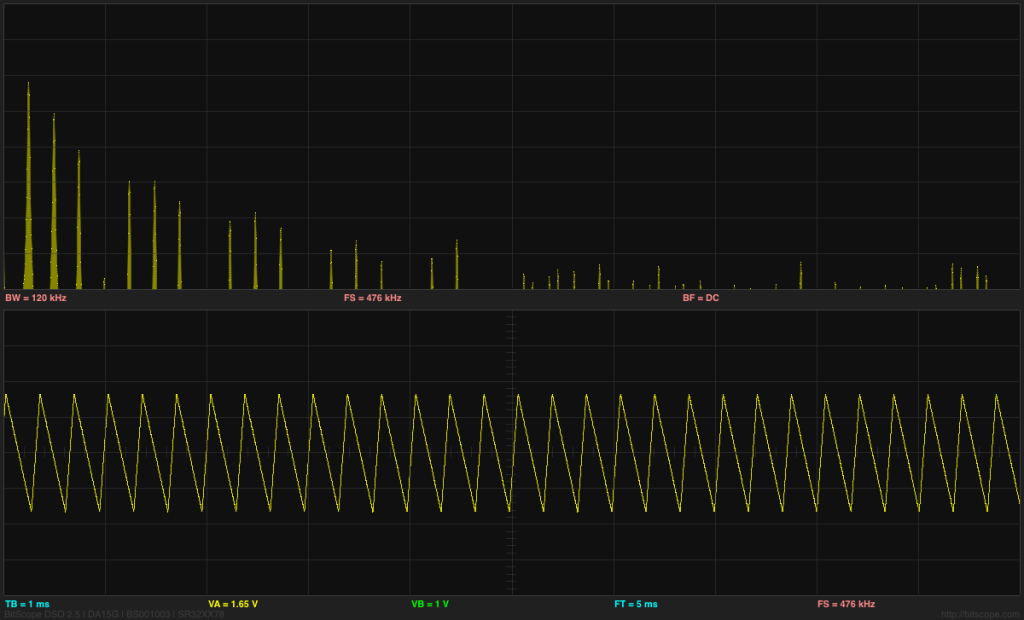
Triangle wave with 25% duty cycle, showing suppression of the 4th, 8th, 12th, and 16th harmonics.
Filed under:
Uncategorized Tagged:
Arduino,
BitScope,
DCT,
Discrete Cosine Transform,
electret mic,
electret microphone,
Fast Fourier Transform,
FFT 


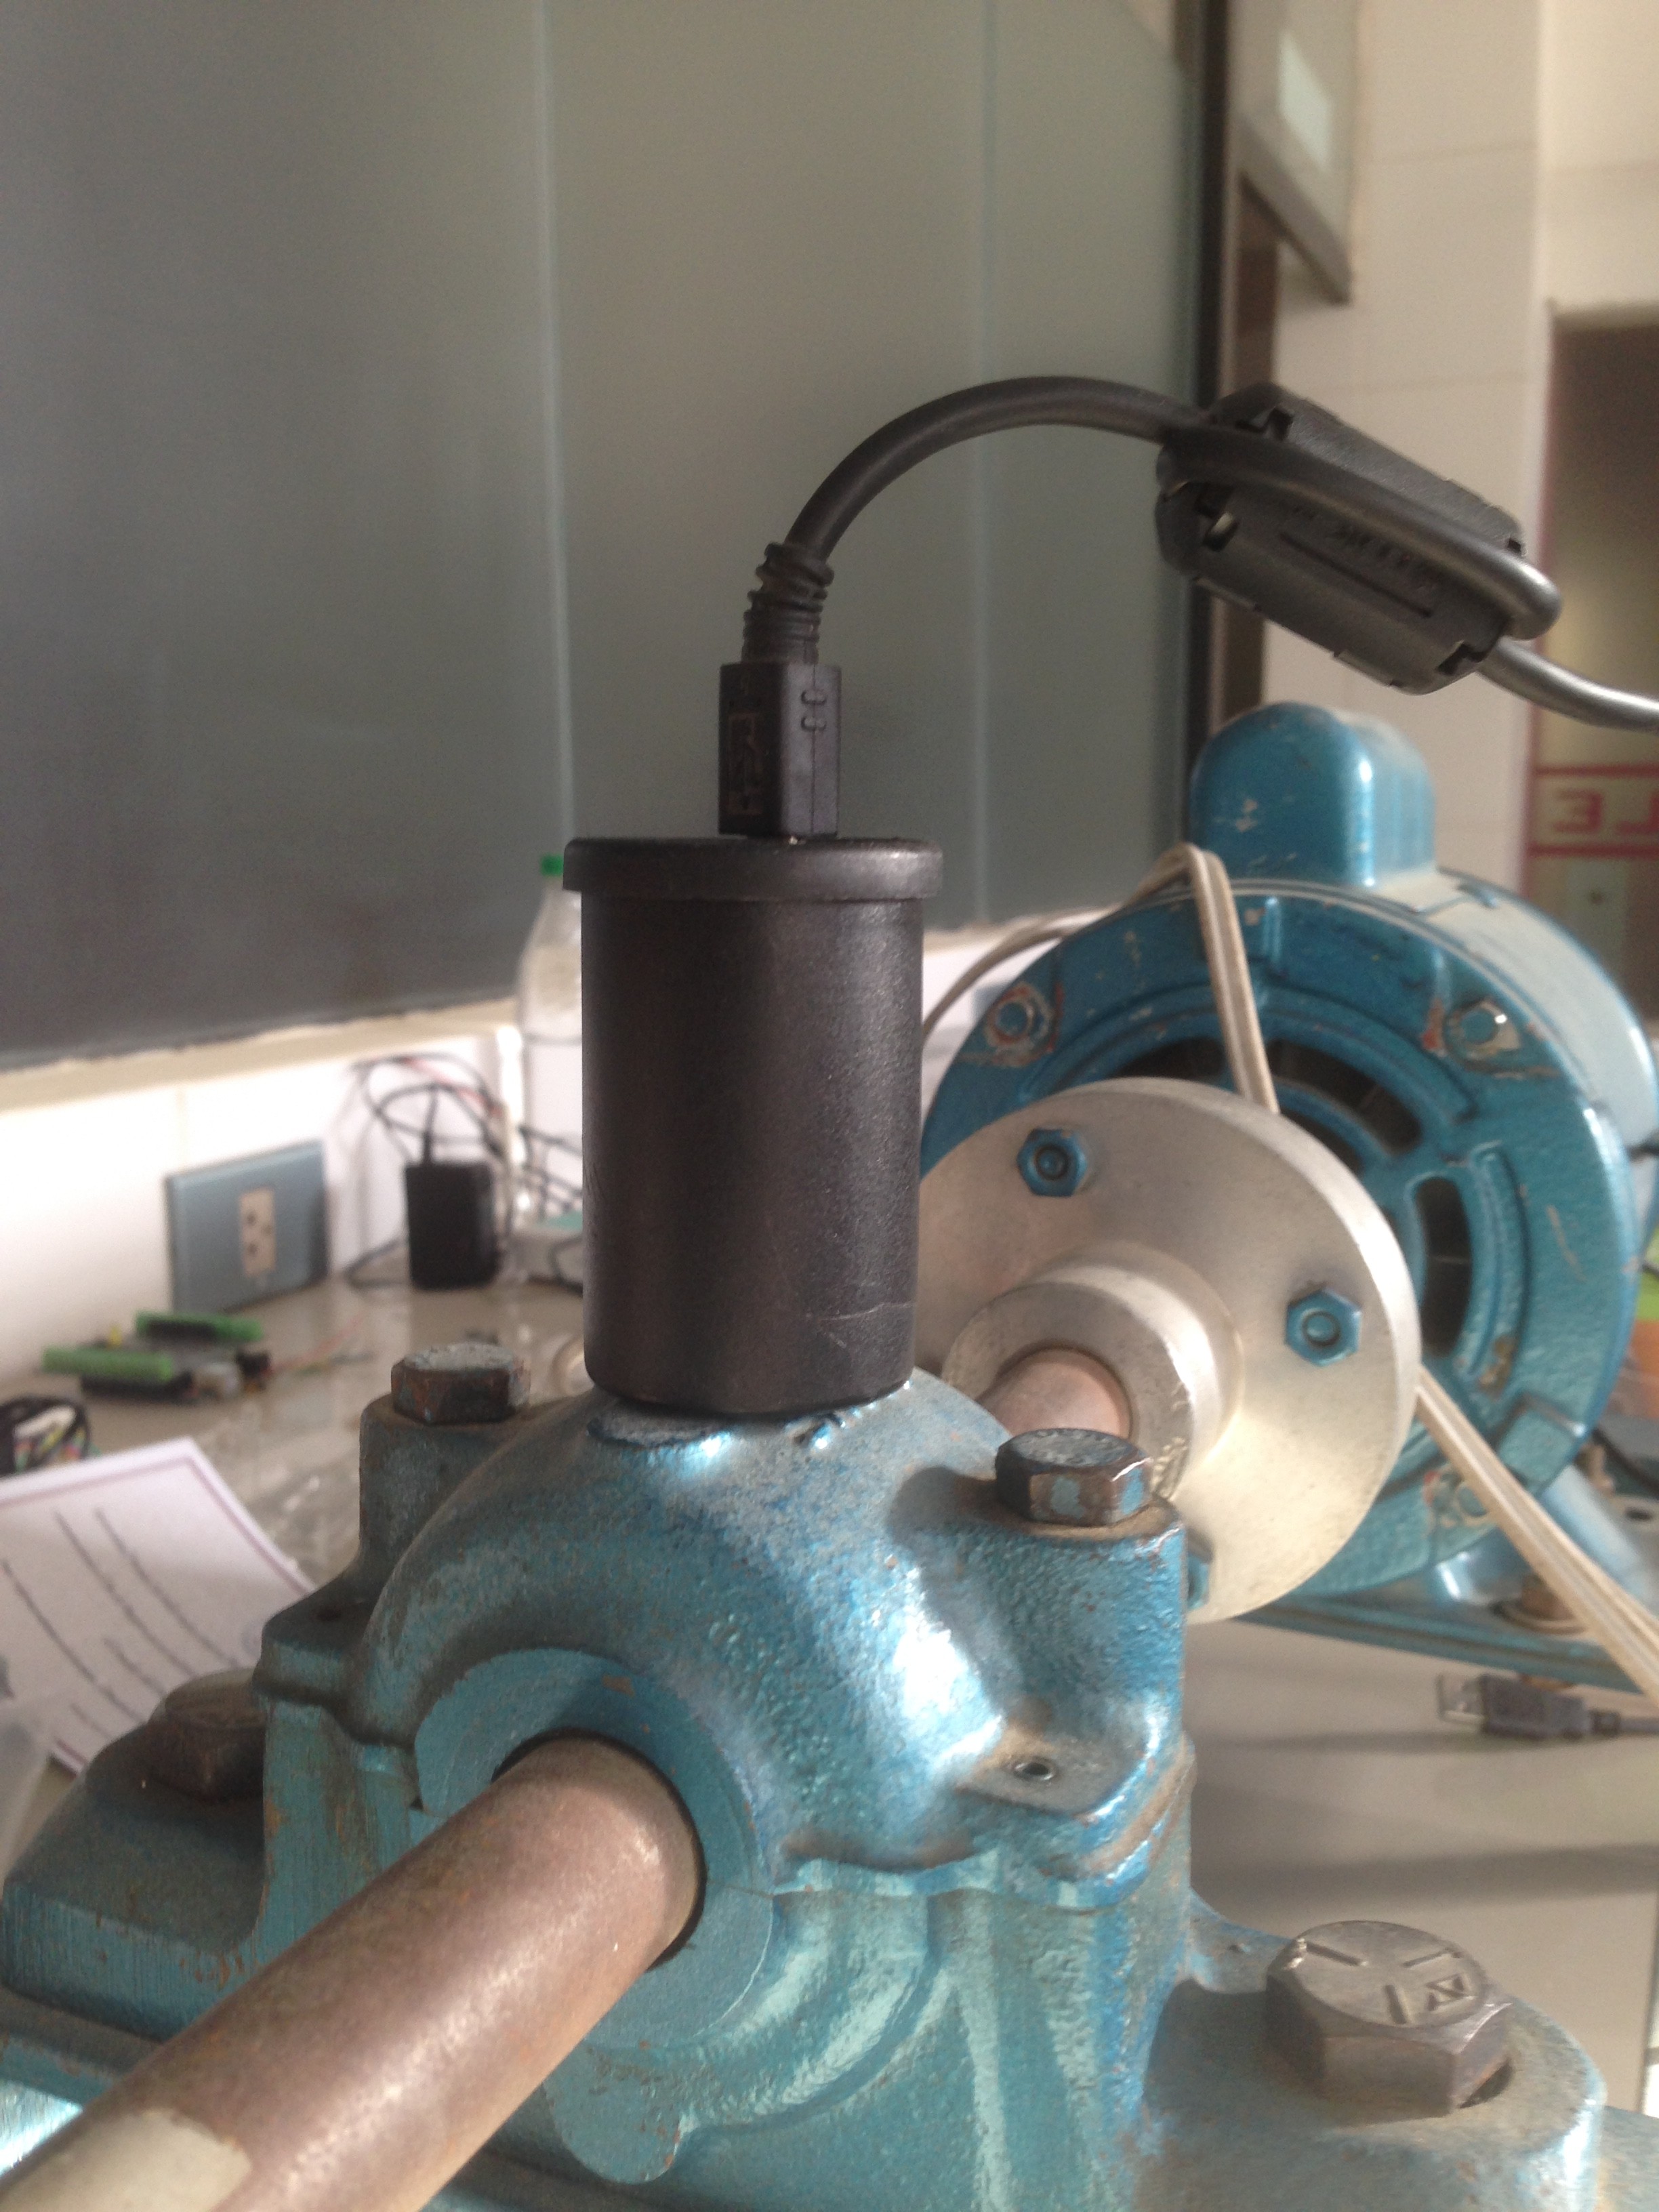 For the hardware side of the spectrum analyzer, [Ariel] equipped an Arduino Nano with an ADXL335 accelerometer, which is able to pick up vibrations within a frequency range of 0 to 1600 Hz on the X and Y axis. A film container, equipped with a strong magnet for easy installation, serves as an enclosure for the sensor. The firmware [Ariel] wrote is an efficient piece of code that samples the analog signals from the accelerometer in a free running loop at about 5000 Hz. It streams the digitized waveforms to a host computer over the serial port, where they are captured and stored by a Python script for further processing.