Updates on some earlier lessons
In Still better I-V plot for Schottky diodes, I had some lessons learned at the end of the post:
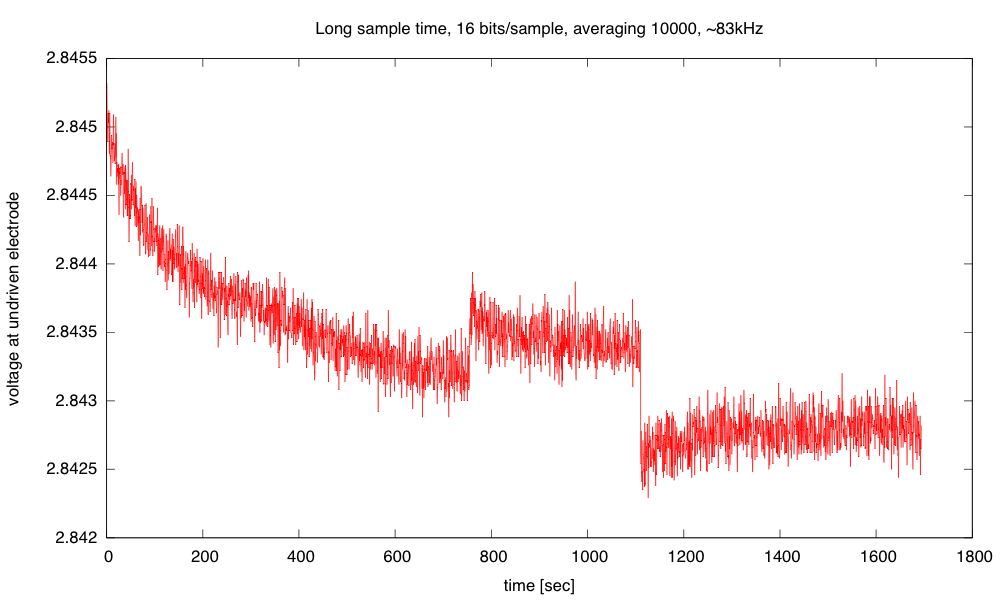
- Higher-resolution ADCs do give smoother curves, with less digitization noise, but they aren’t a panacea for measurement problems. To get most of the resolution, I had to set the ADC to use long sample times and do a lot of averaging. I understand that Freescale Kinetis M series include 24-bit sigma-delta converters for higher precision at much lower speed (24 bits is 7 decimal digits), as well as the high-speed 16-bit successive-approximation converters. Unfortunately, they don’t have a low-cost development board for this series.
- Stay away from the bottom end of the ADC range on the KL25Z. Scale single-ended inputs to have values at least 50, and differential inputs to have values at least 20. There may be similar problems at the top end of the range, but I did not test for them.
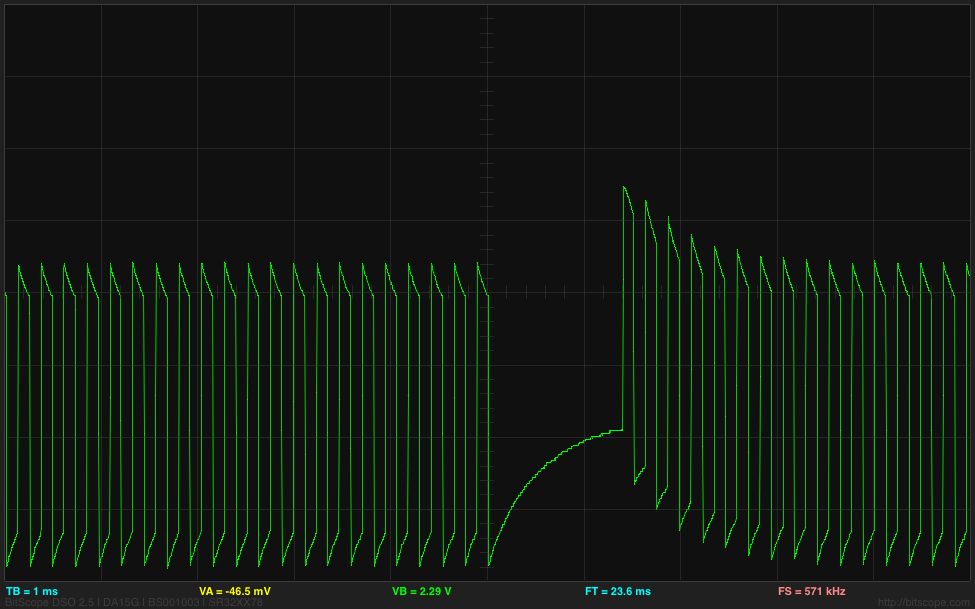
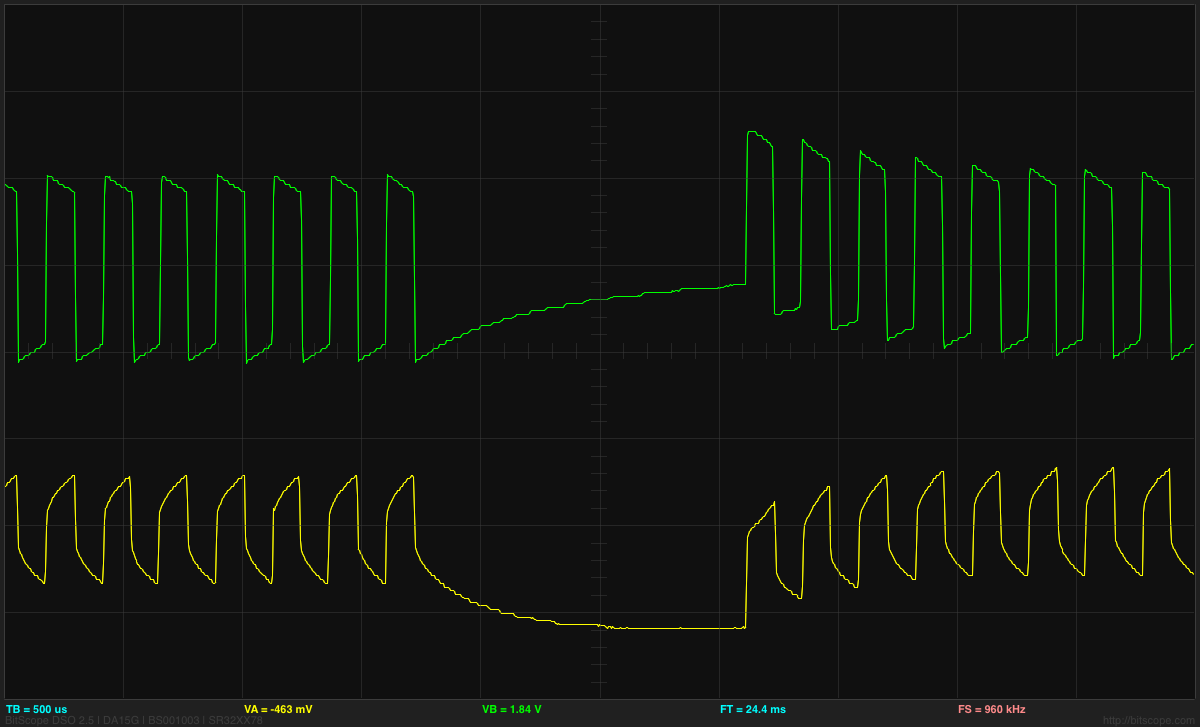
I wondered if the problem may be switching from the large value for the voltage across the diode to the small voltage across the shunt resistor that was the problem. I tried putting in a dummy read between the voltage and the current reads, but that didn’t help at all. At first I thought that the low-count readings were good with the large shunt resistors, but this is probably an illusion: errors in the current measurement for small currents aren’t visible on the plot, because the voltage across the diode is not changing, and so large horizontal errors in the plot are not visible there. - Watch out for AC noise when trying to measure DC parameters. If there are semiconductor junctions around, the noise may be rectified to produce an unwanted DC signal.
- The differential ADC settings have a range of ±VDDA, not ±VDDA/2. This means that the least-significant bit step size is twice as big for differential inputs as for single-ended inputs. For some reason the Freescale documentation never bothers to express what the differential range is.
- Serial USB connections are a bit flakey—the Arduino serial monitor missed a byte about every 200–300 lines. I looked for anomalous points on the plot, then commented out the lines that produced them—they were almost all explainable by one character having been missed by the serial monitor; e.g., I commented out “662401069 86 19″ right after “660001069 865 17″, because the last digit of the voltage (the second field) was missing. The fields were a timestamp (in 24MHz ticks), voltage across the diode (in ADC units), and voltage across the shunt resistance (in ADC units). [Actually, this was not a new lesson for me—I've had to do the same on almost all files collected from the Arduino serial monitor. My son's data logger code is better at not losing data, but it is still worthwhile to check for anomalies.]
- The 3.3v supply from the Freedom board is much cleaner than the 5v USB supply that I get from the Arduino (unless I use an external power supply with the Arduino), but I can only take about 10mA from the 3.3v supply before it begins to droop. If I want more than that, I’d better provide my own power supply (or at least my own LDO regulator from the USB 5v supply).
I’d like to correct a few of those lessons in this post.
- A 24-bit sigma-delta converter is really only about 7 bits of accuracy—you are relying on oversampling with a single-bit comparator, then low-pass filtering. Your resolution is a function of frequency, but the “24-bit” number is misleading—that’s how much precision they carry in the low-pass filter computations, and has little to do with the amount of information you can actually extract from the ADC. I think I was confusing sigma-delta converters (which are fast, cheap, and not very accurate) with dual-slope converters (which are slow and more accurate).
- no update.
- no update.
- no update.
- The UART communication from the Freescale KL25Z boards, using MBED’s code on OpenSDA chip to do the UART to USB conversion is much less reliable than the Arduino serial connections. My son has been doing testing and has found that he can run the Arduino boards up to about 500k baud without losing characters (aside from a small number right after a reset), but the MBED-implemented UART communication on the KL25Z lost tens of character per second even at fairly low speeds (tested own to 62.5kbaud). We suspect a bug in their code in which they ignore the UART port for too long while dealing with the USB side. (He’s not the first to notice that the MBED serial communication is broken on the KL25Z boards.) Using the MBED USB stack natively on the KL25 chip (not the SDA port), he had no noticeable character losses, so the problem is not on the host computer or the software he was testing with, but on the MBED implementation of the USB serial connection on the OpenSDA chip.
This bug in MBED’s serial implementation has raised the complexity of the port of the data acquisition system to the KL25Z enormously, as he’ll have to implement a USB stack (or enough of one to do USB serial) on the KL25, rather than using the buggy one on the OpenSDA chip. The MBED USB stack (written in C++) is not compatible with the bare metal ARM platform he’s been using for the port (which only seems to support C). He’s gotten the USB code to compile and link, but is having trouble getting it to run—we suspect that some part of the C++ memory management has not been initialized properly.
We have not checked whether the PEMicro OpenSDA software works for serial communication—since it doesn’t work for downloading software from the Mac, we can’t use it anyway. - As I reported in Diode-connected nFET characterisitics, the 3.3V LDO on the KL25Z boards is actually pretty good: it can be modeled as 3.32V source with a 55mΩ series resistor. I got a steeper voltage drop above 500mA, but that was from overloading the USB 5v supply that was powering the board, not from problems with the LDO.
I’ve not yet tried powering the board with a beefier power supply on the P5-9V_VIN pin. I suspect that it will be able to handle up to 1.5A without problems (maintaining the 55mΩ impedance).
Filed under: Circuits course Tagged: Arduino, KL25Z, MBED


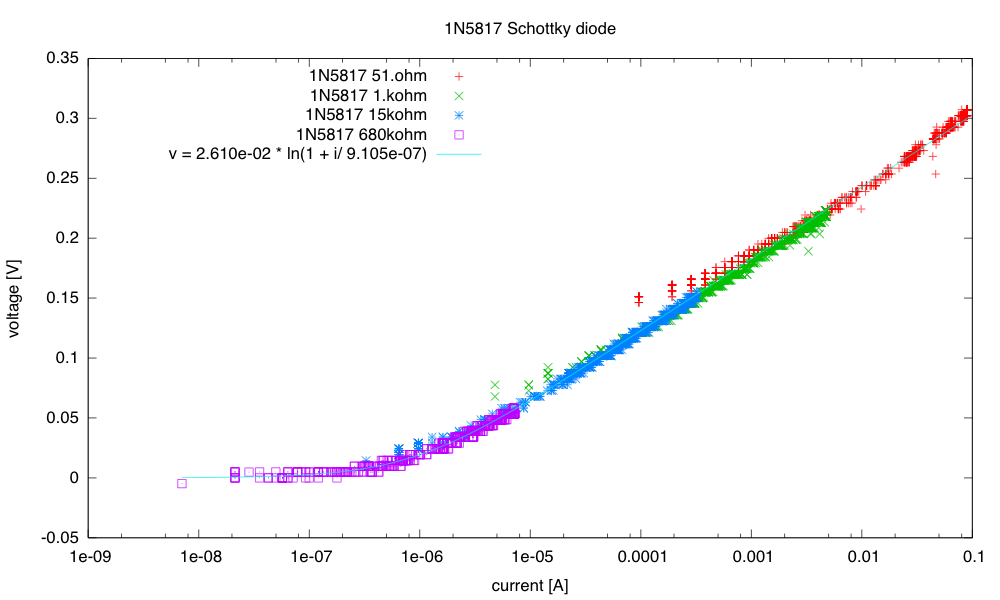
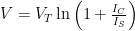 , where IS is the saturation current of the diode, using the following setup


 , where IS is the saturation current of the diode, using the following setup