

Using KL25Z for measuring salinity
Continuing the series of posts on measuring salinity with a couple of resistors and microprocessor
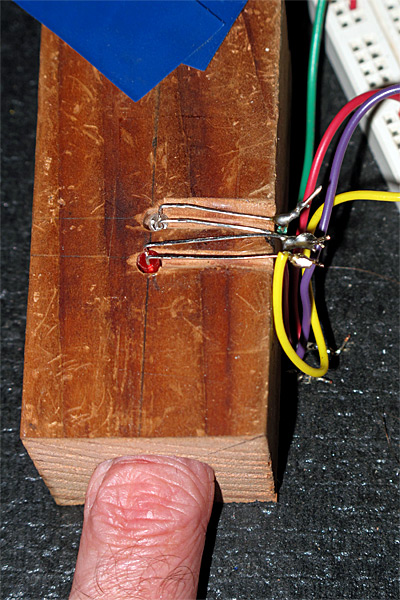
- Towards automatic measurement of conductivity of saline solution describes another possible freshman design project: a conductivity meter using the KL25Z board.
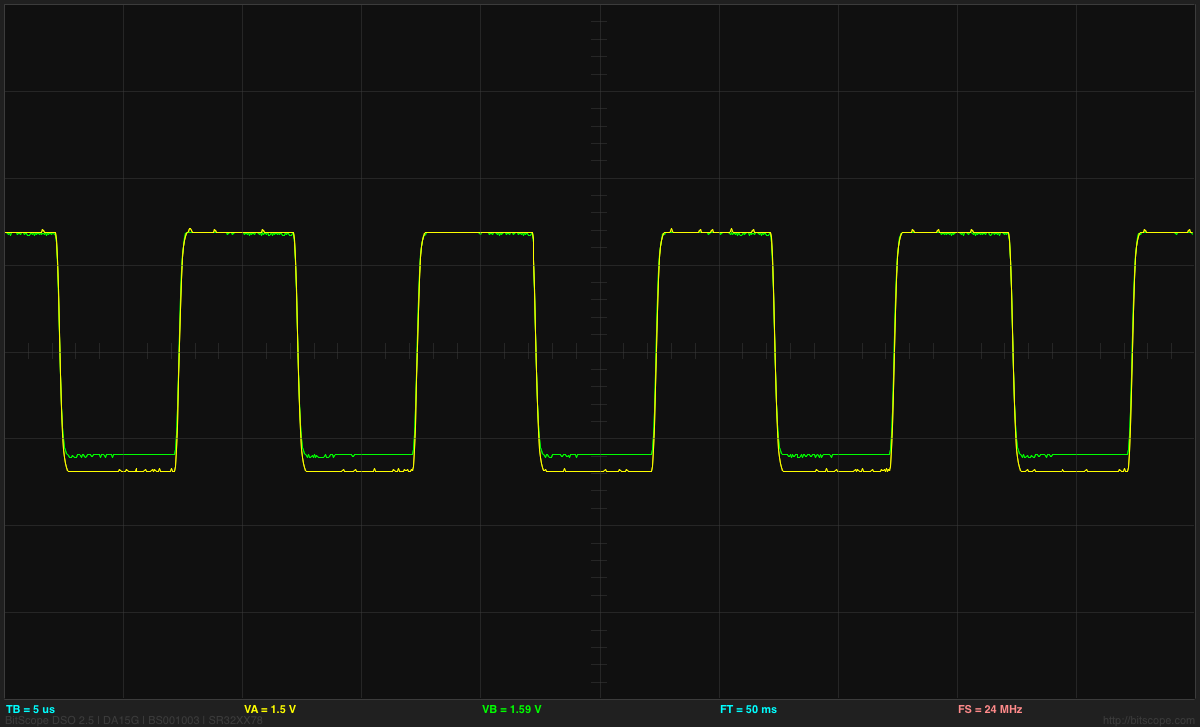
- More on automatic measurement of conductivity of saline solution looks at waveforms for square waves generated using PWM on the KL25Z board. In this post I found that 100kHz square waves would work well.
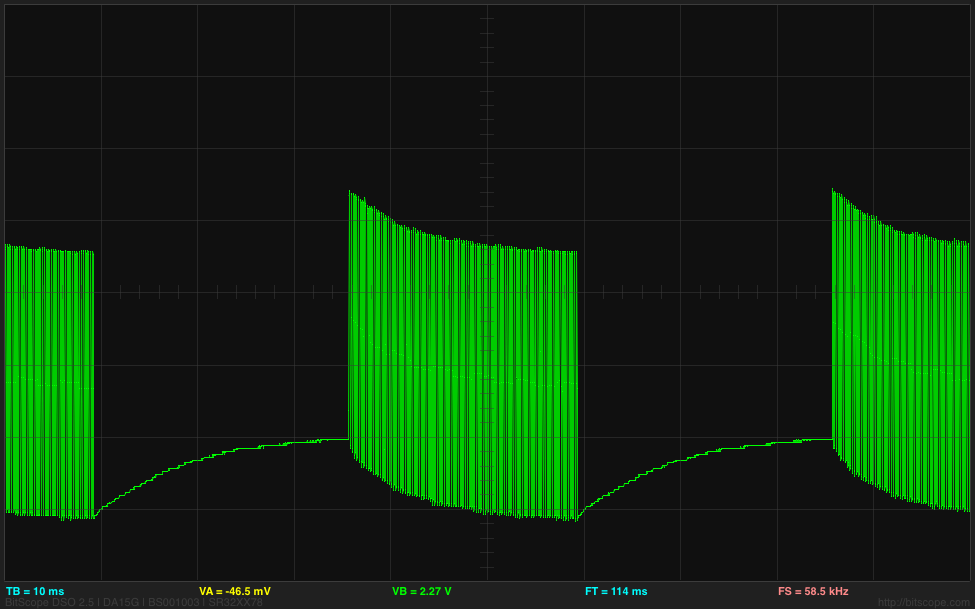
- Still more on automatic measurement of conductivity of saline solution looks at waveforms for bursts of square waves generated by an Arduino board. The bursts are limited to about 4kHz, but that may be good enough for a conductivity meter.
Today I started over on using the KL25Z board. Since I wasn’t interested in precise frequencies, I didn’t use the PWM output this time, but used the same trick I used on the Arduino board: flipping the output bit, reading a sample, and repeating in a burst.
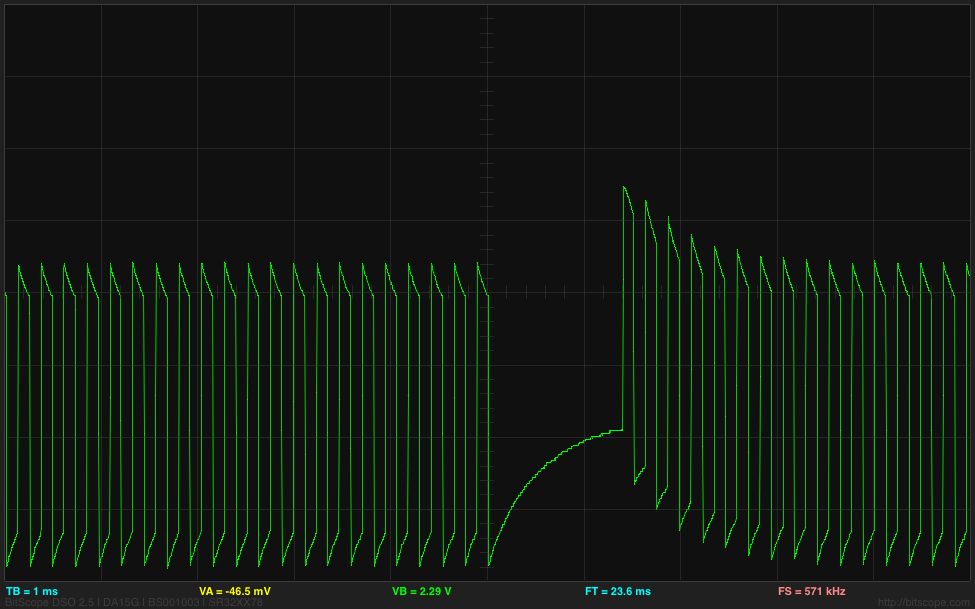
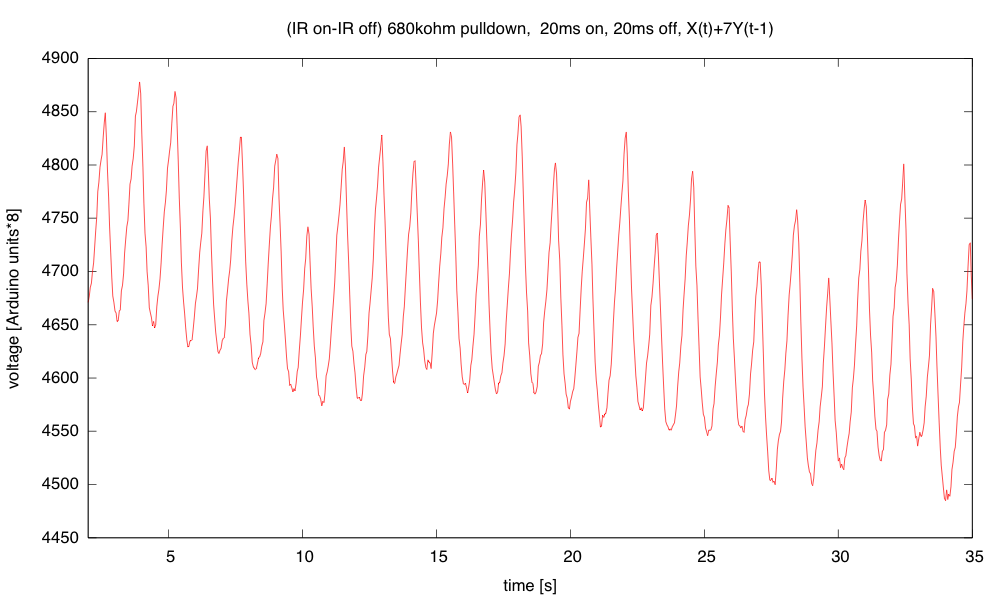
I record the sum of the differences between the high and low readings, and report the average at the end of each burst. By using 40,000 cycles of warmup in each burst (discarded), then averaging over the next 10,000 cycles, I get a voltage reading that has a standard deviation of about 0.1mV on a reading of 2.843V, which is about 14–15 bits of accuracy. The voltage reading is not constant, though, but drifts downward.
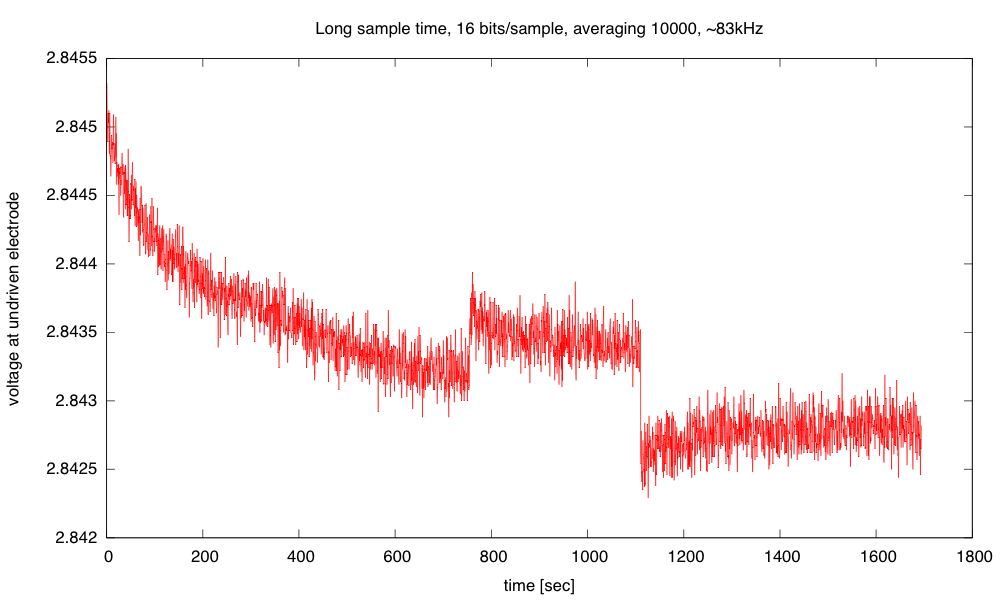
(click to embiggen) Voltage difference at undriven electrode as a function of time. The two sudden steps were probably the result of my jostling the table by putting down my teacup too hard.
I don’t have an explanation of the gradual drift in the voltage. I don’t think that this is a change in the salinity of the solution (which should be unchanged or increasing slowly due to evaporation). but a change in the characteristics of the electrodes. More likely, it is a change in the characteristics of the electrodes. The sudden shifts when the table was jostled may be due to electrodes shifting their position in the cup or the release of a bubble. Releasing a bubble should increase the surface area of the electrode and hence increase the conductivity and the voltage difference at the undriven electrode. The gradual downward shift could be due to building up tiny hydrogen bubbles (too small to see) on the negative electrode. The changes in voltage observed here are less than 0.1%, which is fairly respectable for a homebrew instrument.
Here is the (undocumented, throw-away) code that I wrote today to test out the ideas of an automatic salinity measurement system using a KL25Z:
#include "mbed.h"

DigitalInOut square_out(PTB0);   // PTB0=arduino A0
//PTB0, PTB1, PTD6, and PTD7 I/O have both high drive and normal drive capability selected by the associated PTx_PCRn[DSE] control bit.

AnalogIn IN(PTB1);  // PTB1=Arduino A1

Serial USB_io(USBTX, USBRX);  // defaults to 9600 8N1 (reset in main to 115200 baud)
Timer since_start;

#define WARMUP (40000)    // number of cycles of toggling output before collecting data
#define COLLECT (10000)   // number of cycles of data to sum for each output
#define Vdd (3.3)      // High voltage at output
int main()
{
    USB_io.baud(115200);
    USB_io.printf("\nusec\tvolts\nN\tN\n");

    //DEFAULT configuration of analog input
    ADC0->CFG1 = ADC_CFG1_ADLPC_MASK    // Low-Power Configuration
               | ADC_CFG1_ADIV(3)       // Clock Divide Select: (Input Clock)/8
               | ADC_CFG1_ADLSMP_MASK   // Long Sample Time
               | ADC_CFG1_MODE(3)       // (16)bits Resolution
               | ADC_CFG1_ADICLK(1);    // Input Clock: (Bus Clock)/2

    ADC0->CFG2 = ADC_CFG2_MUXSEL_MASK   // ADxxb channels are selected
               | ADC_CFG2_ADACKEN_MASK  // Asynchronous Clock Output Enable
               | ADC_CFG2_ADHSC_MASK    // High-Speed Configuration
               | ADC_CFG2_ADLSTS(0);    // Long Sample Time Select

    ADC0->SC2 = ADC_SC2_REFSEL(0);      // Default Voltage Reference

    ADC0->SC3 = ADC_SC3_AVGE_MASK       // Hardware Average Enable
                | ADC_SC3_AVGS(0);        // 4 Samples Averaged

    // FAST analog input
    ADC0->CFG1 =
                ADC_CFG1_MODE(3)       // (16)bits Resolution
               | ADC_CFG1_ADLSMP_MASK   // Long Sample Time
               | ADC_CFG1_ADICLK(0);    // Input Clock: (Bus Clock)

    ADC0->CFG2 = ADC_CFG2_MUXSEL_MASK   // ADxxb channels are selected
               | ADC_CFG2_ADACKEN_MASK  // Asynchronous Clock Output Enable
               | ADC_CFG2_ADHSC_MASK    // High-Speed Configuration
               | ADC_CFG2_ADLSTS(0);    // longest "long" Sample Time Select

//             | ADC_CFG2_ADLSTS(3);    // shortest "long" Sample Time Select

    ADC0->SC2 = ADC_SC2_REFSEL(0);      // Default Voltage Reference
    ADC0->SC3 = 0;        // No hardware averaging

    // set PORTB pin 0 to high drive here
    PORTB->PCR[0]  |= PORT_PCR_DSE_MASK;

    since_start.start();
    while(1)
    {
         square_out.output();
         for (int i=0; i
         {
             square_out=1;
             wait_us(1);
             volatile uint16_t rise_read=IN.read_u16();
             square_out=0;
             wait_us(1);
             volatile uint16_t fall_read=IN.read_u16();
        }
        int32_t sum=0;
        for (int i=0;i<COLLECT; i++)
        {
             square_out=1;
             wait_us(1);
             int32_t rise_read=IN.read_u16();
             square_out=0;
             wait_us(1);
             sum += rise_read - IN.read_u16();
        }
        square_out.input(); // hiZ state when not driving pulses

        USB_io.printf("%10d\t%7.5f\n", since_start.read_us(), sum*(Vdd/COLLECT/(1<<16))); // scale output to volts
    }
 }
There is still a lot that needs to be done to make this a finished project, but I’ve convinced myself that it is doable as freshman design project, which is all I really needed to do.
Filed under: Circuits course, freshman design seminar Tagged: Arduino, bioengineering, circuits, conductivity, electrodes, KL25Z


 , where
  . Note that the z values that correspond to sinusoids are along the unit circle, from DC at
  up to the Nyquist frequency
  at
at  .
.
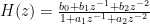
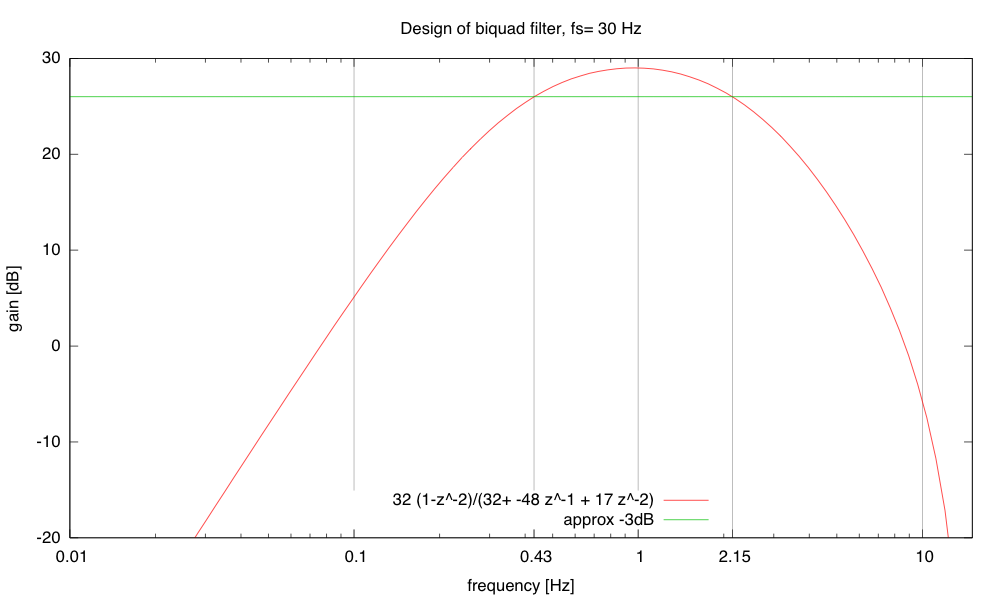
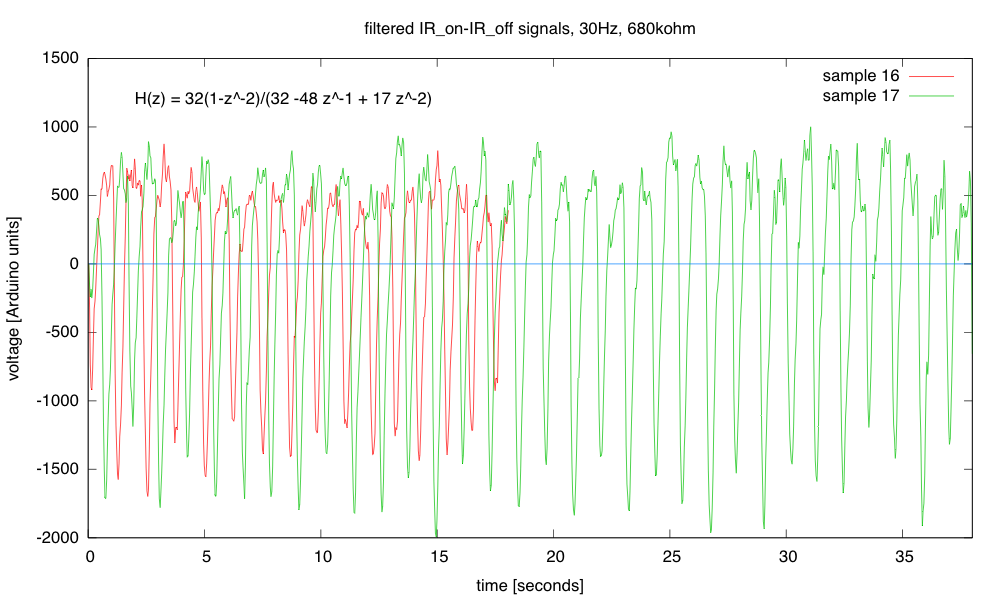
 , and b0=1, b1=0, and b2=–1. The other two parameters it gave me were a2=0.4327386423 and a1=–1.3802466192. Of course, I don’t want to use floating-point arithmetic, but small integer arithmetic, so that the only division I do is by powers of 2 (which the compiler turns into a quick shift operation).


 , where
  . Note that the z values that correspond to sinusoids are along the unit circle, from DC at
  up to the Nyquist frequency
  at
at  .
.
 , and b0=1, b1=0, and b2=–1. The other two parameters it gave me were a2=0.4327386423 and a1=–1.3802466192. Of course, I don’t want to use floating-point arithmetic, but small integer arithmetic, so that the only division I do is by powers of 2 (which the compiler turns into a quick shift operation).


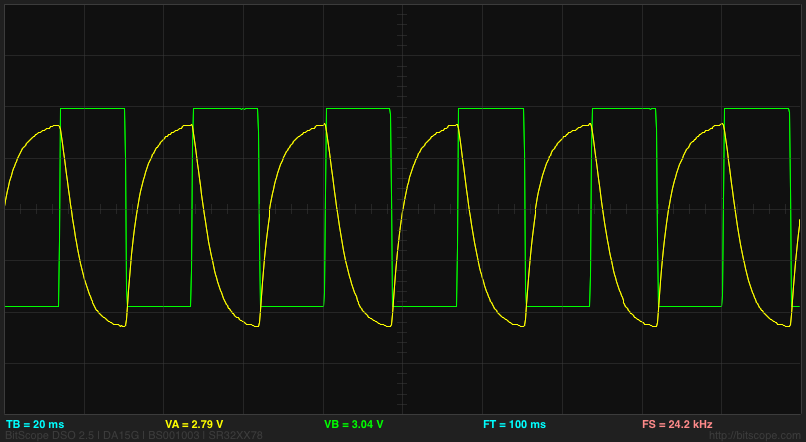
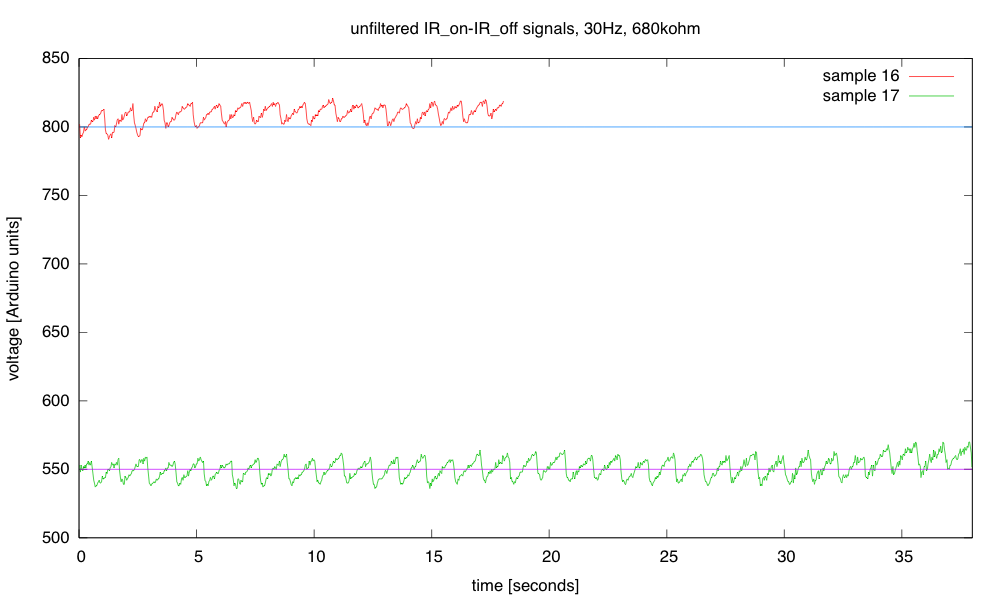
 . Because division is very slow on the Arduino, I limited myself to simple shifts for division: a= 1/2, 1/4, or 1/8. To avoid losing even more precision, I actually output
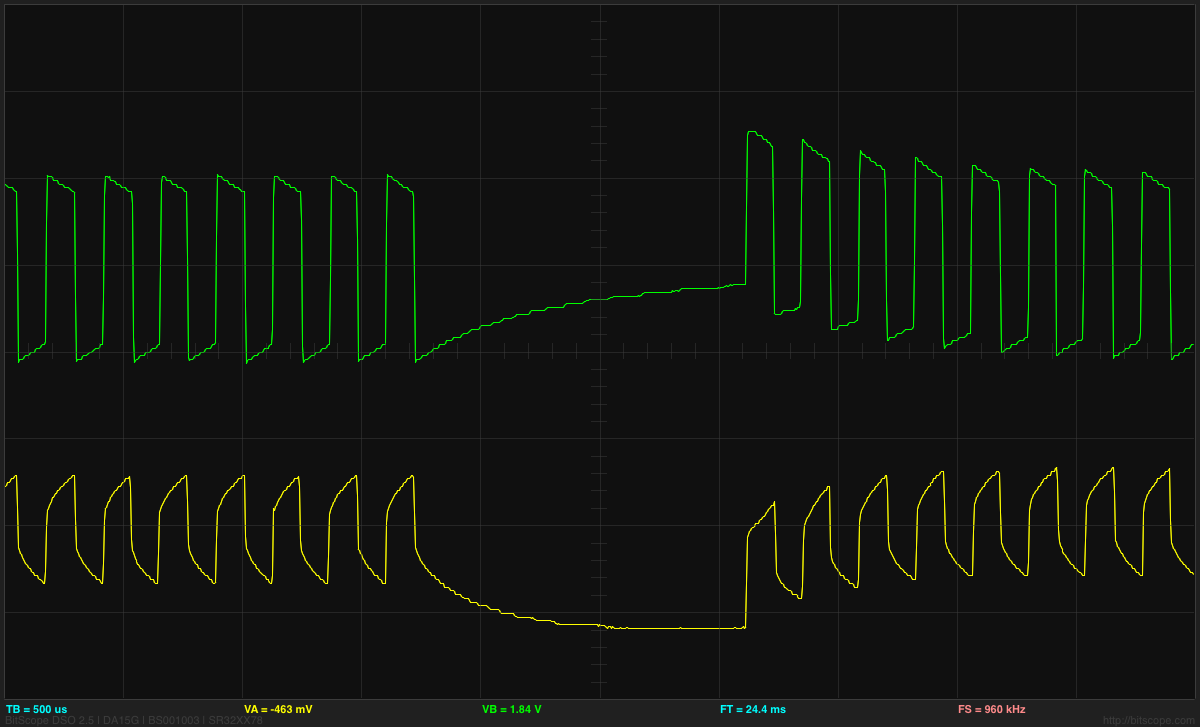
  then divided by 8 to get Y(t). I also used a 40msec sampling period, with the IR emitter on for 20ms, then off for 20msec (the waveform shown in the oscilloscope trace above).


 . Because division is very slow on the Arduino, I limited myself to simple shifts for division: a= 1/2, 1/4, or 1/8. To avoid losing even more precision, I actually output
  then divided by 8 to get Y(t). I also used a 40msec sampling period, with the IR emitter on for 20ms, then off for 20msec (the waveform shown in the oscilloscope trace above).


