Failed attempt at pulse oximeter
In Optical pulse monitor with little electronics and Digital filters for pulse monitor, I developed an optical pulse monitor using an IR emitter, a phototransistor, 2 resistors, and an Arduino. On Thursday, I decided to try to extend this to a pulse oximeter, by adding a red LED (and current-limiting resistor) as well. Because excluding ambient light is so important, I decided to build a mount for everything out of a block of wood:
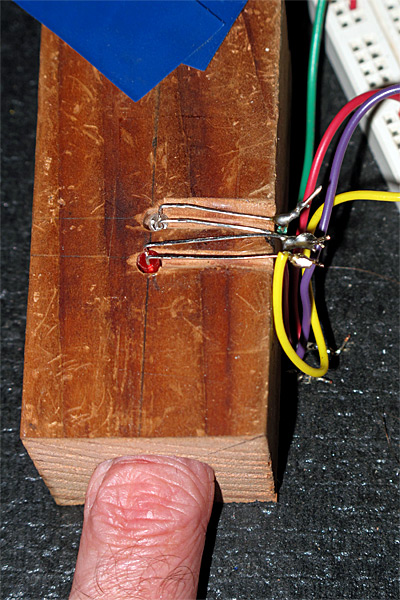
Short piece of 2×2 wood, with a 3/4″ diameter hole drilled with a Forstner bit partway through the block. Two 1/8″ holes drilled for 3mm LEDs on top, and one for a 3mm phototransistor on the bottom (lined up with the red LED). Wiring channels were cut with the same 1/8″ drill bit, and opened up a with a round riffler. Electrical tape holds the LEDs and phototransistor in place (removed here to expose the diodes).
My first test with the new setup was disappointing. The signal from the IR LED swamped out the signal from the red LED, being at least 4 times as large. The RC discharge curves for the phototransistor for the IR signal was slow enough that I would have had to go to a very low sampling rate to see the red LED signal without interference from the discharge from the IR pulse. I could reduce the signal for the IR LED to only twice the red output by increasing the IR current-limiting resistor to 1.5kΩ, and reduce the RC time constant of the phototransistor by reducing the pulldown resistor for it to 100kΩ The reduction in the output of the IR LED and decreased sensitivity of the phototransistor made about a 17-fold reduction in the amplitude of the IR signal, and the red signal was about a thirtieth of what I’d previously been getting for the IR signal. Since the variation in amplitude that made up my real signal was about 10 counts before, it is substantially less than 1 count now, and is too small to be detected even with the digital filters that I used.
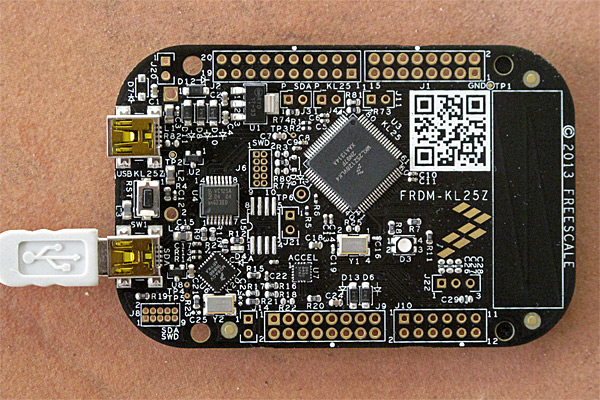
I could probably solve this problem of a small signal by switching from the Arduino to the KL25Z, since going from a 10-bit ADC to a 16-bit ADC would allow a 64 times larger signal-to-noise ratio (that is, +36dB), getting me back to enough signal to be detectable even with the reductions.. I’ve ordered headers from Digi-Key for the KL25Z, so next week I’ll be able to test this.
I did do something very stupid yesterday, though in a misguided attempt to fix the problem. I had another red LED (WP710A10ID) that was listed on the spec sheet as being much brighter than the one I’d been using (WP3A8HD), so I soldered it in. The LED was clearly much brighter, but when I put my finger in the sensor, I got almost no red signal! What went wrong?
A moment’s thought explained the problem to me (I just wish I had done that thinking BEFORE soldering in the LED). Why was the new LED brighter for the same current? It wasn’t that the LED was more efficient at generating photons, but that the wavelength of the light was shorter, and so the eye was more sensitive to it.
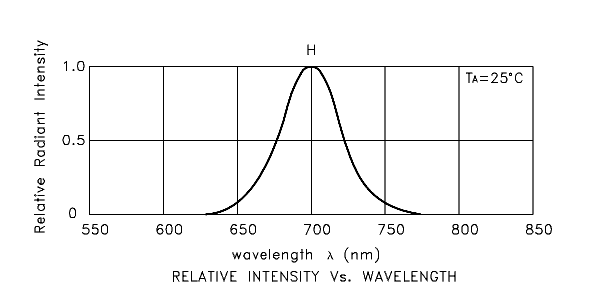
Spectrum of the WP3A8HD red LED that I first used. It has a peak at 700nm and dominant wavelength at 660nm. I believe that the “dominant wavelength” refers to the peak of the spectrum multiplied by the sensitivity of the human eye. Spectrum copied from Kingbright preliminary specification for WP3A8HD.
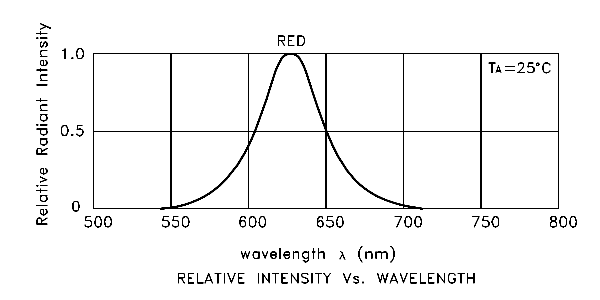
Spectrum of the WP710A10ID brighter red LED that didn’t work for me. The peak is at 627nm and the “dominant wavelength” is 617nm. The extra brightness is coming from this shorter wavelength, where the human eye is more sensitive. Image copied from the Kingbright spec sheet.
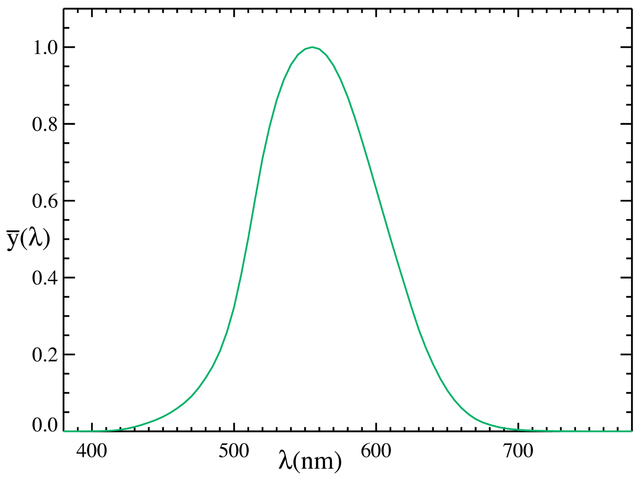
1931 CIE luminosity curve, representing a standardized sensitivity of the human eye with bright lighting (photopic vision). The peak is at 555nm. Note that there are better estimates of human eye sensitivity now available (see the discussion of newer ones in the Wikipedia article on the Luminosity function).
Image copied from Wikipedia.
The new LED is brighter, because the human eye is more sensitive to its shorter wavelength, but the optimum sensitivity of the phototransistor is at longer wavelengths, so the phototransistor is less sensitive to the new LED than to the old one.

Typical spectral sensitivity of a silicon photodiode or phototransistor. This curve does not take into account any absorption losses in the packaging of the part, which can substantially change the response. Note that the peak sensitivity is in the infrared, around 950nm, not in the green around 555nm as with the human eye. Unfortunately, Kingbright does not publish a spectral sensitivity curve for their WP3DP3B phototransistor, so this image is a generic one copied from https://upload.wikimedia.org/wikipedia/commons/4/41/Response_silicon_photodiode.svg
This sensitivity is much better matched to the IR emitter (WP710A10F3C) than to either of the red LEDs:
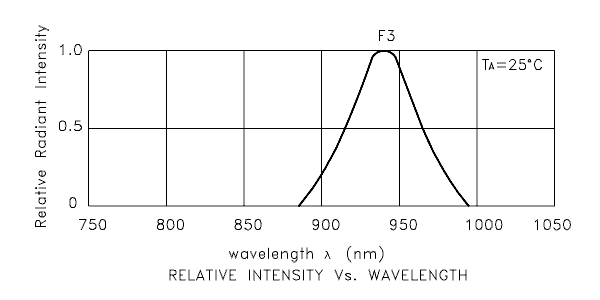
Spectrum for the WP710A10F3C IR emitter, copied from the Kingbright spec sheet. The peak is at 940nm with a 50nm bandwidth. There is no “dominant wavelength”, because essentially all the emissions are outside the range of the human eye.
Furthermore, blood and flesh is more opaque at the shorter wavelength, so I had more light absorbed and less sensitivity in the detector, making for a much smaller signal.
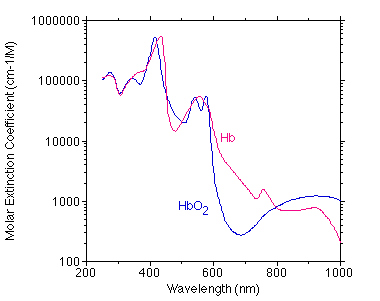
Scott Prahl’s estimate of oxyhemoglobin and deoxyhemoglobin molar extinction coefficients, copied from http://omlc.ogi.edu/spectra/hemoglobin/summary.gif
Tabulated values are available at http://omlc.ogi.edu/spectra/hemoglobin/summary.html and general discussion at http://omlc.ogi.edu/spectra/hemoglobin/
The higher the curve here the less light is transmitted. Note that 700nm has very low absorption (290), but 627nm has over twice as high an absorption (683). Also notice that in the infrared
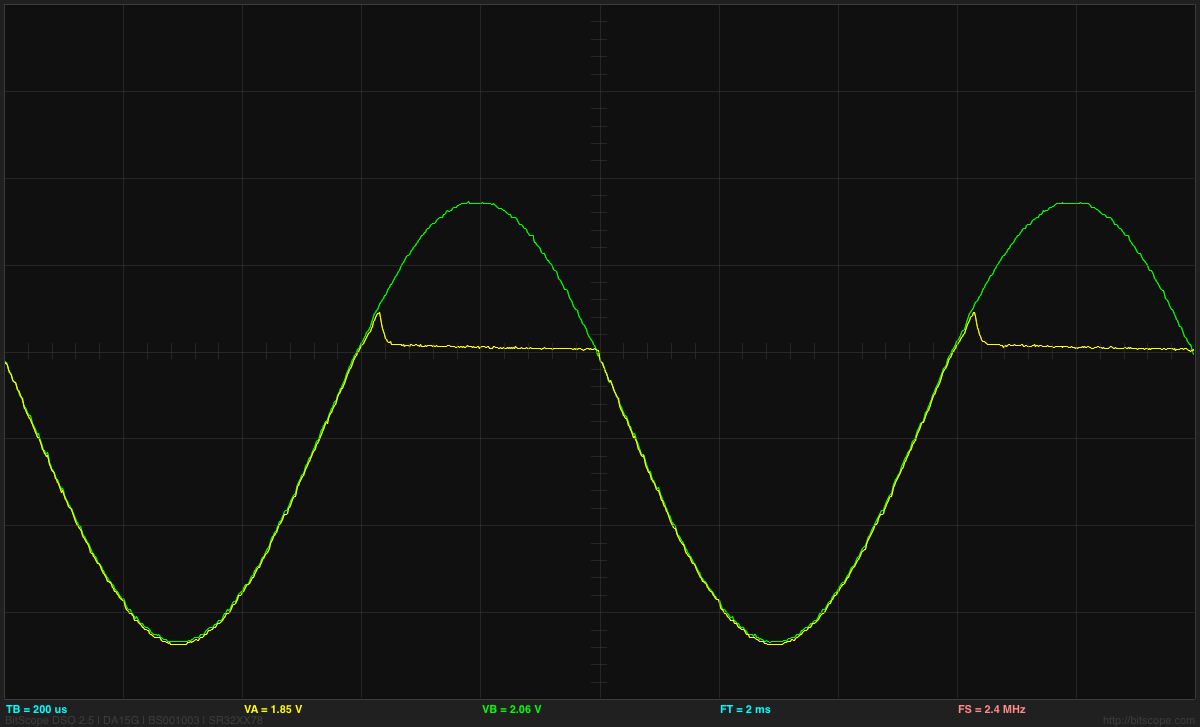
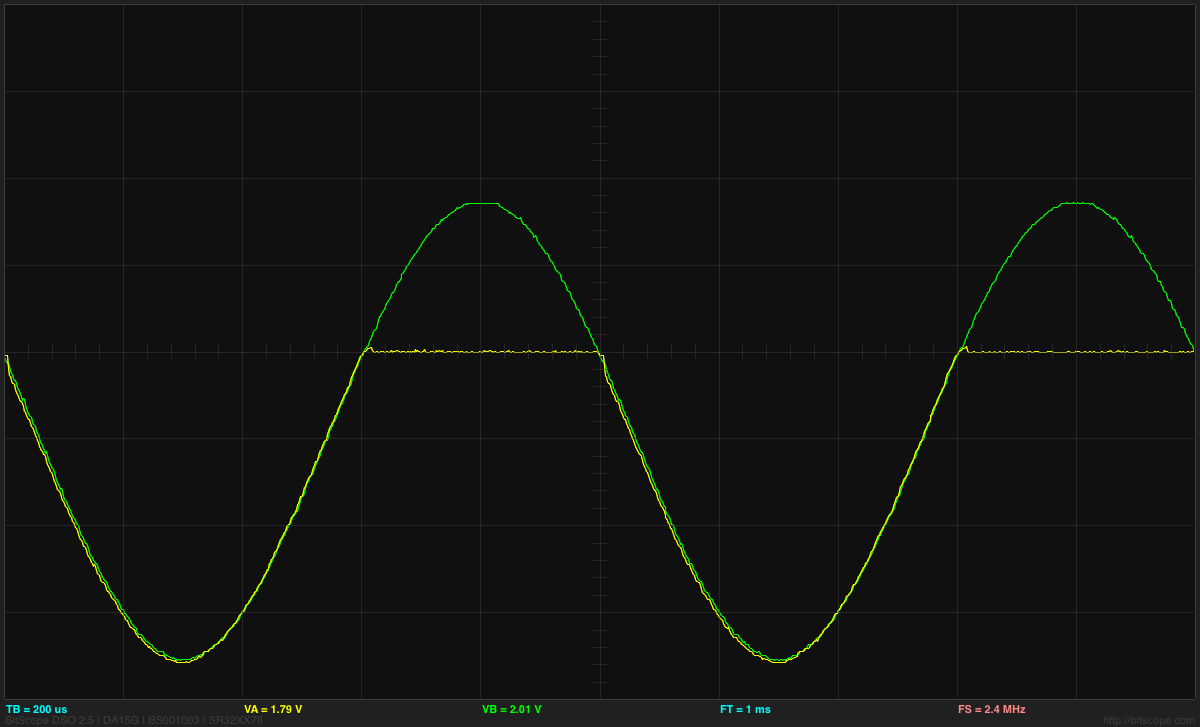
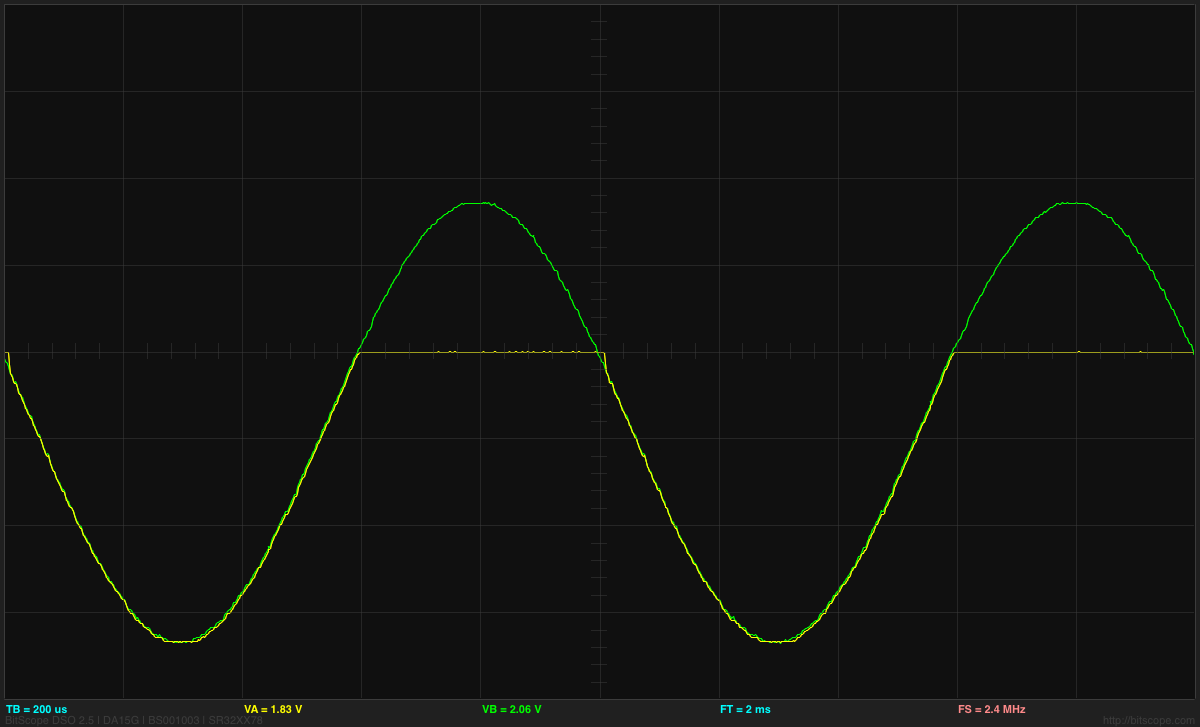
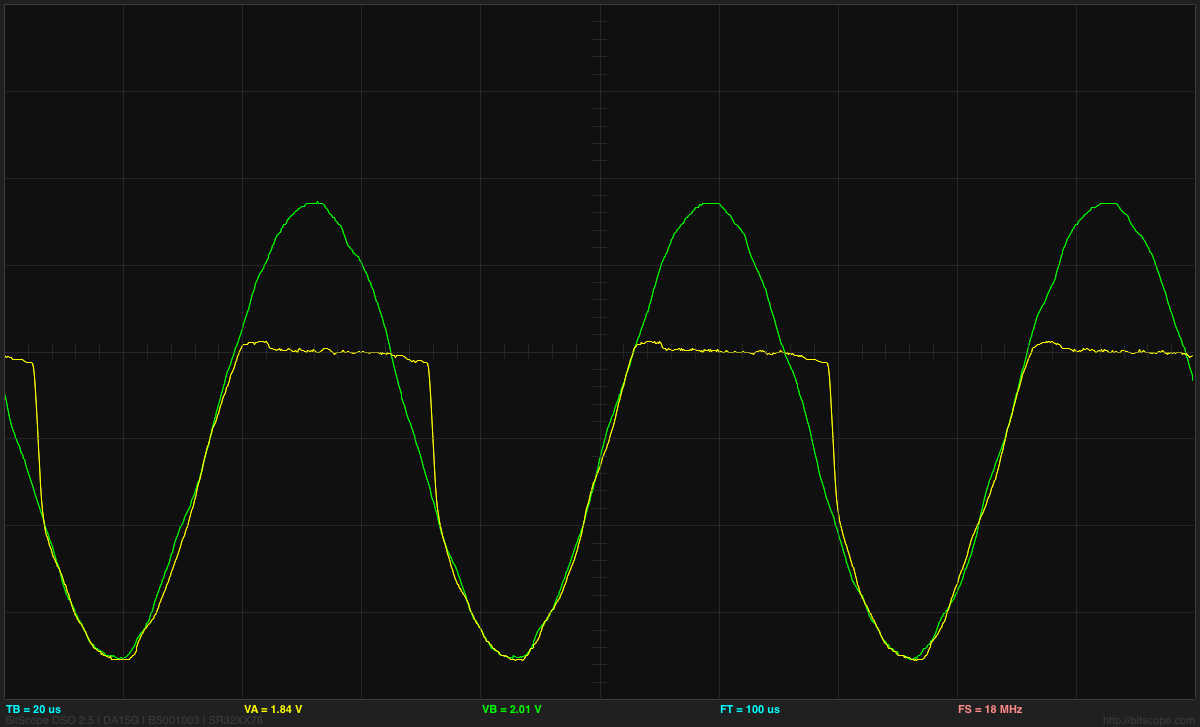
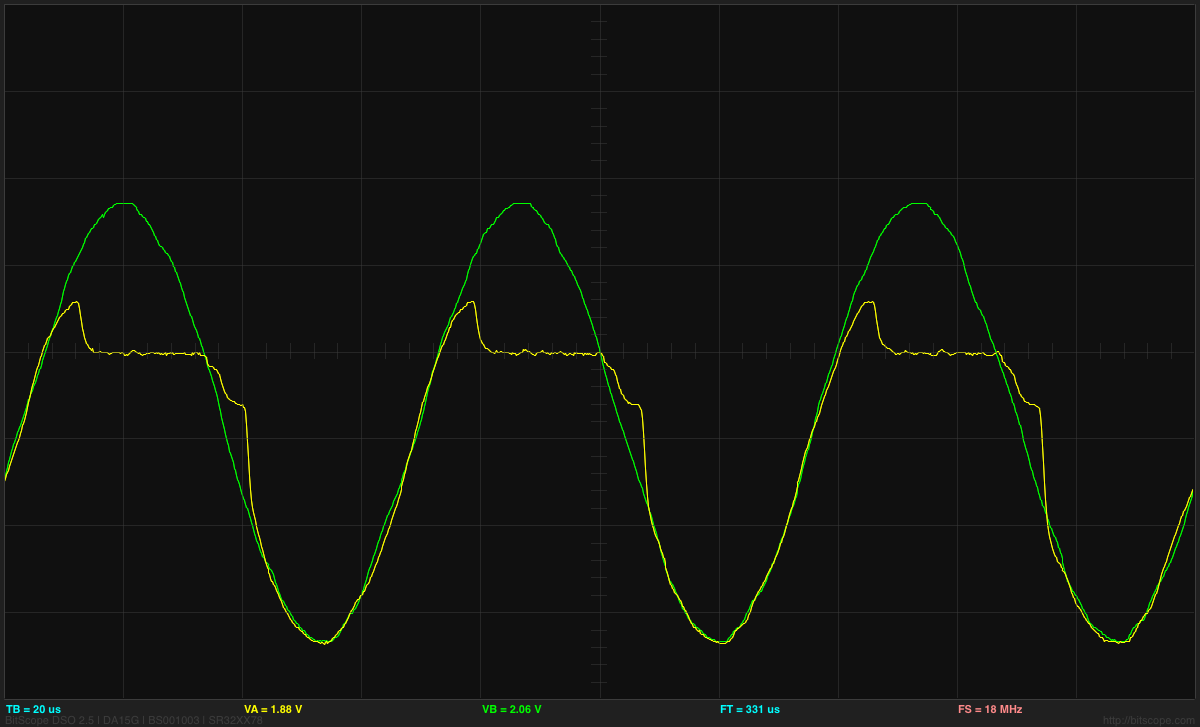
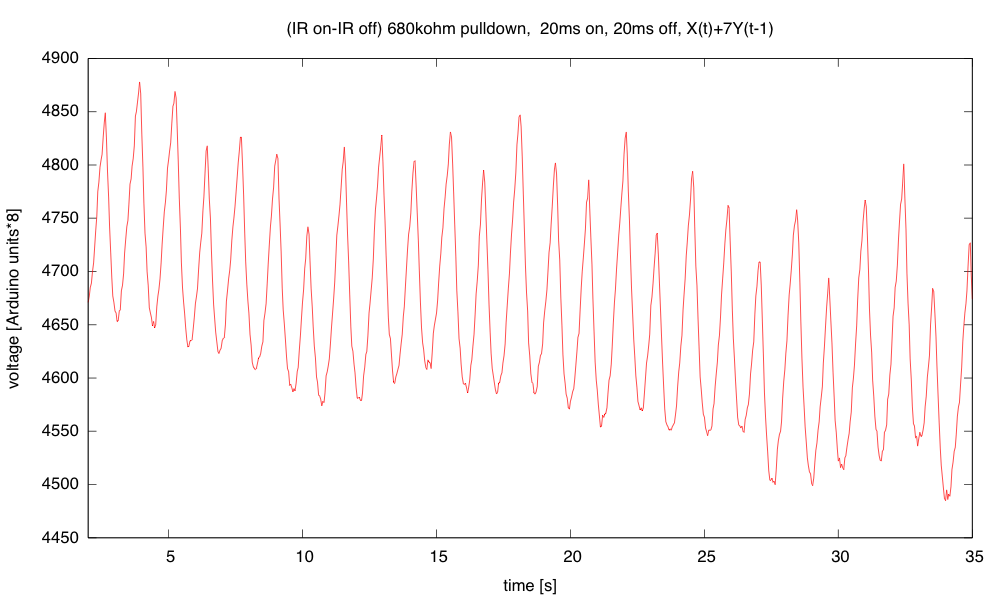
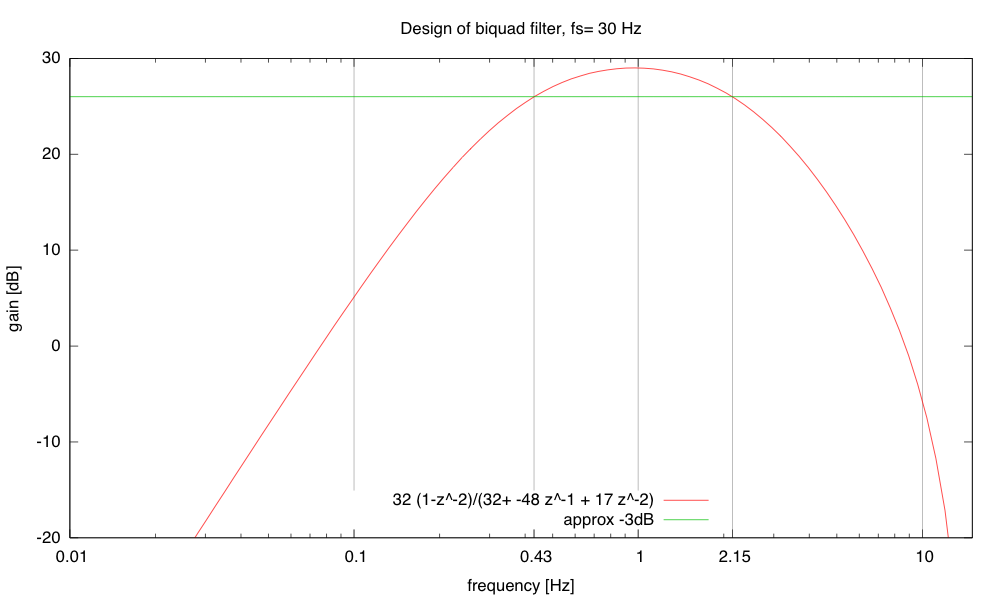
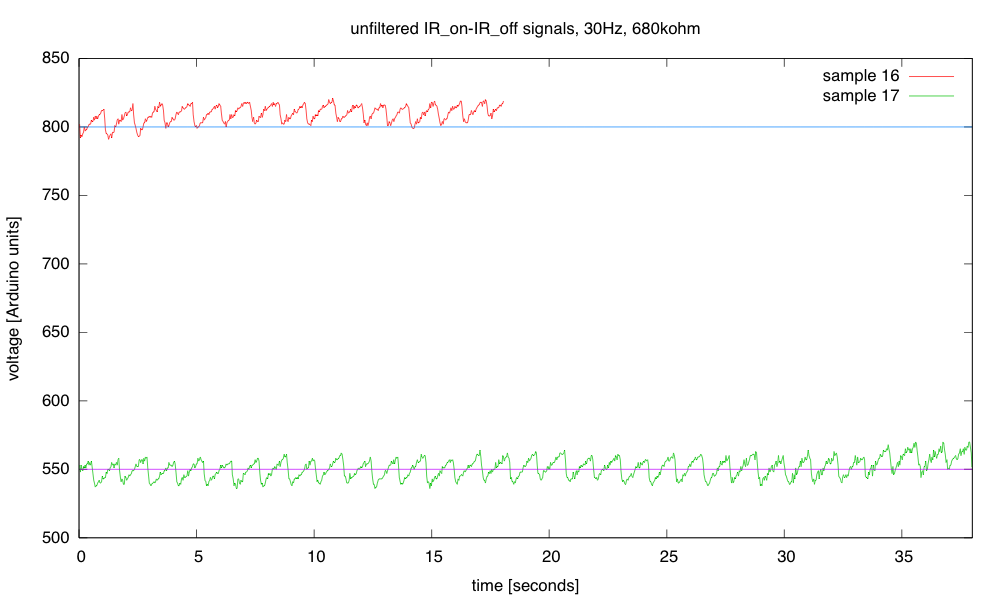
I had to go back to the red LED (WP3A8HD) that I started with. Here is an example of the waveform I get with that LED, dropping the sampling rate to 10Hz:

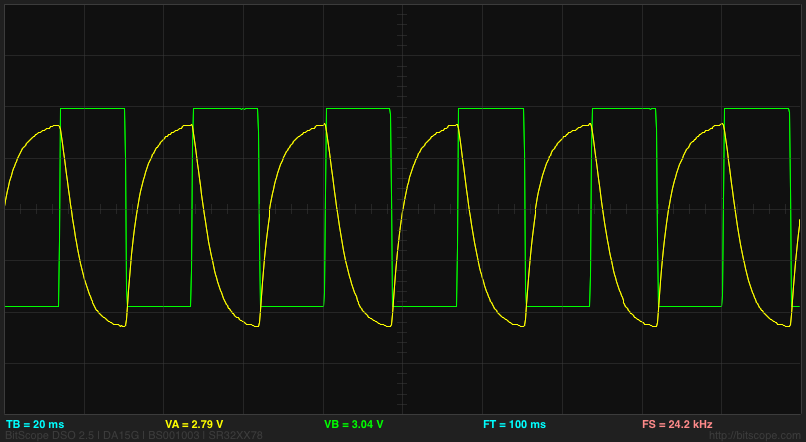
The green waveform is the voltage driving the red LED and through a 100Ω resistor. The red LED is on for the 1/30th of second that the output is low, then the IR LED is on (through a 1.5kΩ resistor) for 1/30th of a second, then both are off. THe yellow trace shows the voltage at the phototransistor emitter with a 680kΩ pulldown.
This signal seems to have too little amplitude for the variation to be detected with the Arduino (the scale is 1v/division with 0v at the bottom of the grid).
I can try increasing the signal by using 2 or more red LEDs (though the amount of current needed gets large), or I could turn down the IR signal to match the red signal and use an amplifier to get a big enough signal for the Arduino to read. Sometimes it seems like a 4.7kΩ resistor on the IR emitter matches the output, and sometimes there is still much more IR signal received, depending on which finger I use and how I hold it in the device.
I was thinking of playing with some amplification, but I could only get a gain of about 8, and even then I’d be risking saturation of the amplifier. I think I’ll wait until the headers come and I can try the KL25Z board—the gain of 64 from the higher resolution ADC is likely to be more useful. If that isn’t enough, I can try adding gain also. I could also eliminate the “off-state” and just amplify the difference between IR illumination and red illumination. I wonder if that will let me detect the pulse, though.
Filed under: Circuits course, freshman design seminar Tagged: Arduino, biquad filter, digital filter, IIR filter, IR emitter, LED, phototransistor, pulse, pulse monitor, pulse oximeter


 , where
  . Note that the z values that correspond to sinusoids are along the unit circle, from DC at
  up to the Nyquist frequency
  at
at  .
.
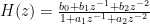
 , and b0=1, b1=0, and b2=–1. The other two parameters it gave me were a2=0.4327386423 and a1=–1.3802466192. Of course, I don’t want to use floating-point arithmetic, but small integer arithmetic, so that the only division I do is by powers of 2 (which the compiler turns into a quick shift operation).


 , where
  . Note that the z values that correspond to sinusoids are along the unit circle, from DC at
  up to the Nyquist frequency
  at
at  .
.
 , and b0=1, b1=0, and b2=–1. The other two parameters it gave me were a2=0.4327386423 and a1=–1.3802466192. Of course, I don’t want to use floating-point arithmetic, but small integer arithmetic, so that the only division I do is by powers of 2 (which the compiler turns into a quick shift operation).


 . Because division is very slow on the Arduino, I limited myself to simple shifts for division: a= 1/2, 1/4, or 1/8. To avoid losing even more precision, I actually output
  then divided by 8 to get Y(t). I also used a 40msec sampling period, with the IR emitter on for 20ms, then off for 20msec (the waveform shown in the oscilloscope trace above).