Posts with «seismometer» label

USB Mouse Hack for Pachyderm Protection

When most of us think of seismometers, our minds conjure up images of broken buildings, buckled roads, and search and rescue teams digging through rubble. But when [Subir Bhaduri] his team were challenged with solving real world problems as frugally as possible as part of the 2020 Frugal Science course, he thought of farmers in rural India for whom losing crops due to raiding elephants is a reality. Such raids can and have caused loss of life for humans and elephants alike. How could he apply scientific means to prevent such conflicts, and do it on the cheap?

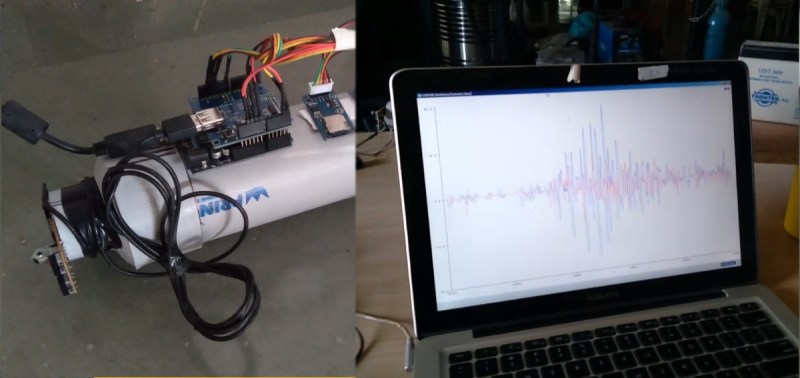
Whether inspiration came from using a computer mouse with the cursor speed turned up to “orbital velocity” is debatable, but [Subir] set forth to find out if such sensitivity could be leveraged for the seismic detection of the aforementioned elephants. His proof of concept is a fantastically frugal low cost seismograph using an optical mouse and some cheap PVC pipe and fittings.

We invite you to watch the video below the break to find out how it works. You’ll be impressed as we were by [Subir]’s practical application of engineering principles. And keep your eyes open for the beautiful magnetic damper hack. It’s a real treat!

If pontificating pesky pachyderms p-waves piques your interest, perhaps you’ll appreciate previous projects which produce data with piezo pickups and plumbing parts.

We Have a Problem: Earthquake Prediction

Nepal | 25 April 2015 | 11:56 NST

It was a typical day for the 27 million residents of Nepal – a small south Asian country nestled between China and India. Men and women went about their usual routine as they would any other day. Children ran about happily on school playgrounds while their parents earned a living in one of the country’s many industries. None of them could foresee the incredible destruction that would soon strike with no warning. The 7.8 magnitude earthquake shook the country at its core. 9,000 people died that day. How many didn’t have to?

History is riddled with earthquakes and their staggering death tolls. Because many are killed by collapsing infrastructure, even a 60 second warning could save many thousands of lives. Why can’t we do this? Or a better question – why aren’t we doing this? Meet [Micheal Doody], a Reproductive Endocrinologist with a doctorate in physical biochemistry. While he doesn’t exactly have the background needed to pioneer a novel approach to predict earthquakes, he’s off to a good start.

He uses piezoelectric pressure sensors at the heart of the device, but they’re far from the most interesting parts. Three steel balls, each weighing four pounds, are suspended from a central vertical post. Magnets are used to balance the balls 120 degrees apart from each other. They exert a lateral force on the piezo sensors, allowing for any movement of the vertical post to be detected. An Arduino and some amplifiers are used to look at the piezo sensors.

The system is not meant to measure actual vibration data. Instead it looks at the noise floor and uses statistical analysis to see any changes in the background noise. Network several of these sensors along a fault line, and you have yourself a low cost system that could see an earthquake coming, potentially saving thousands of lives.

[Michael] has a TON of data on his project page. Though he’s obviously very skilled, he is not an EE or software guy. He could use some help with the signal analysis and other parts. If you would like to lend a hand and help make this world a better place, please get in touch with him.

He makes a great point during his narration in this video: earthquakes disproportionately affect the poor because they live and work in lower-cost structures unlikely to be outfitted to withstand earthquakes. Shoring up infrastructure is a huge and costly undertaking. Discovering early warning systems like the one [Michael] is testing here will have an immediate and wide-ranging impact at a minimum cost.


Filed under: Hackaday Columns

Printing Text with a Chart Recorder

Chart recorders are vintage devices that were used to plot analog values on paper. They’re similar to old seismometers which plot seismic waves from earthquakes. The device has a heated pen which moves across a piece of thermally sensitive paper. This paper is fed through the machine at a specified rate, which gives two dimensions of plotting.

[Marv] ended up getting a couple of discontinued chart recorders and figured out the interface. Five parallel signals control the feed rate of the paper, and an analog voltage controls the pen location. The next logical step was to hook up an Arduino to control the plotter.

However, once the device could plot analog values, [Marv] quickly looked for a new challenge. He wanted to write characters and bitmaps using the device, but this would require non-continuous lines. By adding a solenoid to lift the pen, he built a chart recorder printer.

After the break, check out a video of the chart recorder doing something it was never intended to do. If you happen to have one of these chart recorders, [Marv] included all of the code in his writeup to help you build your own.


Filed under: classic hacks