

Profiling An Arduino
In proper, high-dollar embedded development environments – and quite a few free and open source ones, as well – you get really cool features like debugging, emulation, and profiling. The Arduino IDE doesn’t feature any of these bells a whistles, so figuring out how much time is spent in one section of code is nigh impossible. [William] came up with a clever solution to this problem, and while it doesn’t tell you exactly how much time is spent on a specific line of code, it’s still a good enough tool to be a great help in optimization.
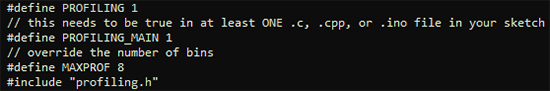
[William]‘s solution is to create a ‘bin’ for arbitrary chunks of code – one for each subroutine or deeply nested loop. When the profiler run, you end up with a histogram of how much time is spent per block of code. This is done with an interrupt that runs at about 1 kHz, with macros sprinkled around the code. Each time the interrupt ticks, the macro runs and increases a counter by one. Let the sketch run for a minute or so, and you get an idea of how much time is spent in a specific area of code.
It’s a bit of a kludge, but when you’re dealing with extremely minimal tools, any sort of help in debugging is sorely needed and greatly appreciated.
Filed under: Arduino Hacks

