Posts with «freetronics» label

Tutorial: Arduino and the MSGEQ7 Spectrum Analyzer

This is a tutorial on using the MSGEQ7 Spectrum Analyser with Arduino, and chapter forty-eight of a series originally titled “Getting Started/Moving Forward with Arduino!” by John Boxall – A tutorial on the Arduino universe. The first chapter is here, the complete series is detailed here.

Updated 10/11/2014

In this article we’re going to explain how to make simple spectrum analysers with an Arduino-style board. (Analyser? Analyzer? Take your pick).

First of all, what is a spectrum analyser? Good question. Do you remember what  this is?

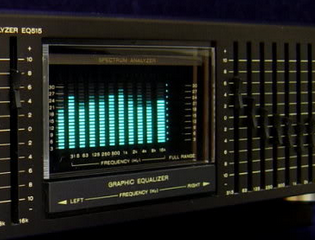
It’s a mixed graphic equaliser/spectrum analyser deck for a hi-fi system. The display in the middle is the spectrum analyser, and roughly-speaking it shows the strength of  different frequencies in the music being listened to – and looked pretty awesome doing it. We can recreate displays similar to this for entertainment and also as a base for creative lighting effects. By working through this tutorial you’ll have the base knowledge to recreate these yourself.

We’ll be using the MSGEQ7 “seven band graphic equaliser IC” from Mixed Signal Integration. Here’s the MSGEQ7 data sheet (.pdf).  This little IC can accept a single audio source, analyse seven frequency bands of the audio, and output a DC representation of each frequency band. This isn’t super-accurate or calibrated in any way, but it works. You can get the IC separately, for example:


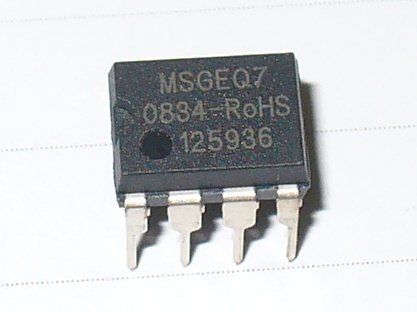
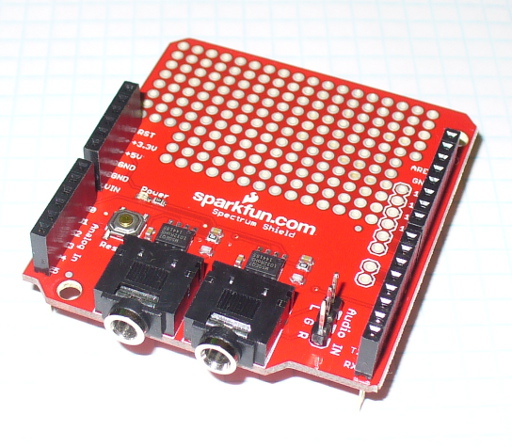
and then build your own circuit around it… or like most things in the Arduino world – get a shield. In this case, a derivative of the original Bliptronics shield by Sparkfun. It’s designed to pass through stereo audio via 3.5mm audio sockets and contains two MSGEQ7s, so we can do a stereo analyser:

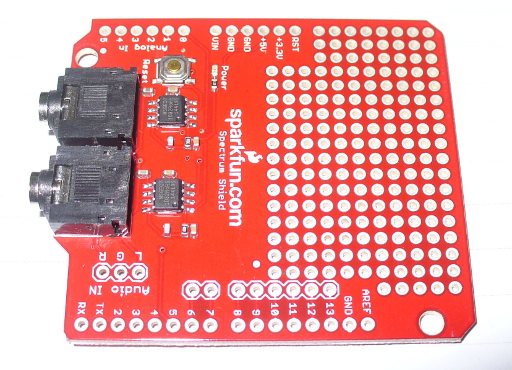
As usual Sparkfun have saved a few cents by not including the stackable header sockets, so you’ll need to buy and solder those in yourself. There is also space for three header pins for direct audio input (left, right and common), which are useful – so if you can add those as well.

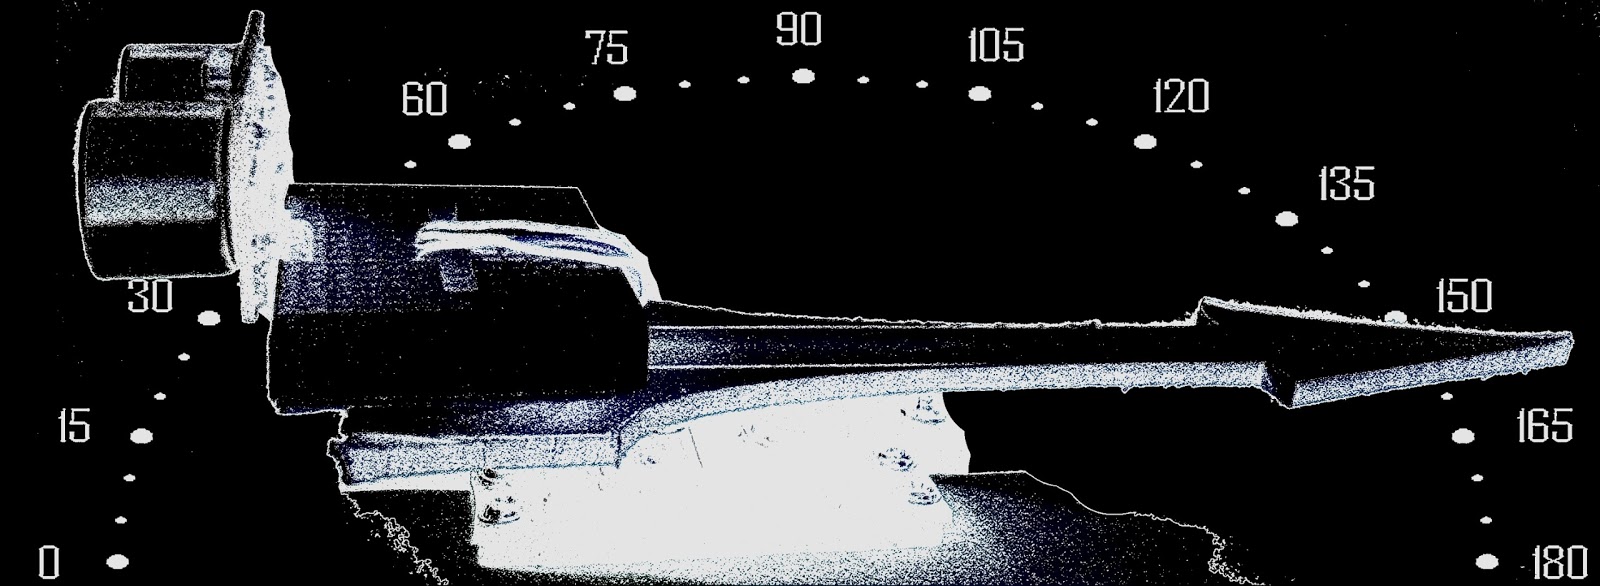
So now you have a shield that’s ready for use. Before moving forward let’s examine how the MSGEQ7 works for us. As mentioned earlier, it analyses seven frequency bands. These are illustrated in the following graph from the data sheet:

It will return the strengths of the audio at seven points – 63 Hz, 160 Hz, 400 Hz, 1 kHz, 2.5 kHz, 6.25 kHz and 16 kHz – and as you can see there is some overlap between the bands. The strength is returned as a DC voltage – which we can then simply measure with the Arduino’s analogue input and create a display of some sort. At this point audio purists, Sheldonites and RF people might get a little cranky, so once again – this is more for visual indication than any sort of calibration device.

However as an 8-pin IC a different approach is required to get the different levels. The IC will sequentially give out the levels for each band on pin 3- e.g. 63 Hz then 160 Hz then 400 Hz then 1 kHz then 2.5 kHz then 6.25 kHz  then 16 kHz then back to 63 Hz and so on. To start this sequence we first reset the IC by pulsing the RESET pin HIGH then low. This tells the IC to start at the first band. Next, we set the STROBE pin to LOW, take the DC reading from pin 3 with analogue input, store the value in a variable (an array), then set the STROBE pin HIGH. We repeat the strobe-measure sequence six more times to get the rest of the data, then RESET the IC and start all over again. For the visual learners consider the diagram below from the data sheet:

To demonstrate this process, consider the function

readMSGEQ7()

in the following example sketch:

// Example 48.1 - tronixstuff.com/tutorials > chapter 48 - 30 Jan 2013 
// MSGEQ7 spectrum analyser shield - basic demonstration
int strobe = 4; // strobe pins on digital 4
int res = 5; // reset pins on digital 5
int left[7]; // store band values in these arrays
int right[7];
int band;
void setup()
{
 Serial.begin(115200);
 pinMode(res, OUTPUT); // reset
 pinMode(strobe, OUTPUT); // strobe
 digitalWrite(res,LOW); // reset low
 digitalWrite(strobe,HIGH); //pin 5 is RESET on the shield
}
void readMSGEQ7()
// Function to read 7 band equalizers
{
 digitalWrite(res, HIGH);
 digitalWrite(res, LOW);
 for(band=0; band <7; band++)
 {
 digitalWrite(strobe,LOW); // strobe pin on the shield - kicks the IC up to the next band 
 delayMicroseconds(30); // 
 left[band] = analogRead(0); // store left band reading
 right[band] = analogRead(1); // ... and the right
 digitalWrite(strobe,HIGH); 
 }
}
void loop()
{
 readMSGEQ7();
 // display values of left channel on serial monitor
 for (band = 0; band < 7; band++)
 {
 Serial.print(left[band]);
 Serial.print(" ");
 }
 Serial.println();
// display values of right channel on serial monitor
 for (band = 0; band < 7; band++)
 {
 Serial.print(right[band]);
 Serial.print(" ");
 }
 Serial.println();
}

If you follow through the sketch, you can see that it reads both left- and right-channel values from the two MSGEQ7s on the shield, then stores each value in the arrays left[] and right[]. These values are then sent to the serial monitor for display – for example:

If you have a function generator, connect the output to one of the channels and GND – then adjust the frequency and amplitude to see how the values change. The following video clip is a short demonstration of this – we set the generator to 1 kHz and adjust the amplitude of the signal. To make things easier to read we only measure and display the left channel:


Keep an eye on the fourth column of data – this is the analogRead() value returned by the Arduino when reading the 1khz frequency band. You can also see the affect on the other bands around 1 kHz as we increase and decrease the frequency. However that wasn’t really visually appealing – so now we’ll create a small and large graphical version.

First we’ll use an inexpensive LCD, the I2C model from akafugu reviewed previously. To save repeating myself, also review how to create custom LCD characters from here.

With the LCD with have two rows of sixteen characters. The plan is to use the top row for the levels, the left-channel’s on … the left, and the right on the right. Each character will be a little bar graph for the level. The bottom row can be for a label. We don’t have too many pixels to work with, but it’s a compact example:

We have eight rows for each character, and the results from an analogueRead() fall between 0 and 1023. So that’s 1024 possible values spread over eight sections. Thus each row of pixels in each character will represent 128 “units of analogue read” or around 0.63 V if the Arduino is running from true 5 V (remember your AREF notes?). The sketch will again read the values from the MSGEQ7, feed them into two arrays – then display the required character in each band space  on the LCD.

Here’s the resulting sketch:

// Example 48.2 - tronixstuff.com/tutorials > chapter 48 - 30 Jan 2013 
// MSGEQ7 spectrum analyser shield and I2C LCD from akafugu
// for akafugu I2C LCD
#include "Wire.h"
#include "TWILiquidCrystal.h"
LiquidCrystal lcd(50);
// create custom characters for LCD
byte level0[8] = { 0b00000, 0b00000, 0b00000, 0b00000, 0b00000, 0b00000, 0b00000, 0b11111};
byte level1[8] = { 0b00000, 0b00000, 0b00000, 0b00000, 0b00000, 0b00000, 0b11111, 0b11111};
byte level2[8] = { 0b00000, 0b00000, 0b00000, 0b00000, 0b00000, 0b11111, 0b11111, 0b11111};
byte level3[8] = { 0b00000, 0b00000, 0b00000, 0b00000, 0b11111, 0b11111, 0b11111, 0b11111};
byte level4[8] = { 0b00000, 0b00000, 0b00000, 0b11111, 0b11111, 0b11111, 0b11111, 0b11111};
byte level5[8] = { 0b00000, 0b00000, 0b11111, 0b11111, 0b11111, 0b11111, 0b11111, 0b11111};
byte level6[8] = { 0b00000, 0b11111, 0b11111, 0b11111, 0b11111, 0b11111, 0b11111, 0b11111};
byte level7[8] = { 0b11111, 0b11111, 0b11111, 0b11111, 0b11111, 0b11111, 0b11111, 0b11111};
int strobe = 4; // strobe pins on digital 4
int res = 5; // reset pins on digital 5
int left[7]; // store band values in these arrays
int right[7];
int band;
void setup()
{
 Serial.begin(9600);
 // setup LCD and custom characters
 lcd.begin(16, 2);
 lcd.setContrast(24);
 lcd.clear();
lcd.createChar(0,level0);
 lcd.createChar(1,level1);
 lcd.createChar(2,level2);
 lcd.createChar(3,level3);
 lcd.createChar(4,level4);
 lcd.createChar(5,level5);
 lcd.createChar(6,level6);
 lcd.createChar(7,level7);
 lcd.setCursor(0,1);
 lcd.print("Left");
 lcd.setCursor(11,1);
 lcd.print("Right");
 pinMode(res, OUTPUT); // reset
 pinMode(strobe, OUTPUT); // strobe
 digitalWrite(res,LOW); // reset low
 digitalWrite(strobe,HIGH); //pin 5 is RESET on the shield
}
void readMSGEQ7()
// Function to read 7 band equalizers
{
 digitalWrite(res, HIGH);
 digitalWrite(res, LOW);
 for( band = 0; band < 7; band++ )
 {
 digitalWrite(strobe,LOW); // strobe pin on the shield - kicks the IC up to the next band 
 delayMicroseconds(30); // 
 left[band] = analogRead(0); // store left band reading
 right[band] = analogRead(1); // ... and the right
 digitalWrite(strobe,HIGH); 
 }
}
void loop()
{
 readMSGEQ7();
// display values of left channel on LCD
 for( band = 0; band < 7; band++ )
 {
 lcd.setCursor(band,0);
 if (left[band]>=895) { lcd.write(7); } else
 if (left[band]>=767) { lcd.write(6); } else
 if (left[band]>=639) { lcd.write(5); } else
 if (left[band]>=511) { lcd.write(4); } else
 if (left[band]>=383) { lcd.write(3); } else
 if (left[band]>=255) { lcd.write(2); } else
 if (left[band]>=127) { lcd.write(1); } else
 if (left[band]>=0) { lcd.write(0); }
 }
 // display values of right channel on LCD
 for( band = 0; band < 7; band++ )
 {
 lcd.setCursor(band+9,0);
 if (right[band]>=895) { lcd.write(7); } else
 if (right[band]>=767) { lcd.write(6); } else
 if (right[band]>=639) { lcd.write(5); } else
 if (right[band]>=511) { lcd.write(4); } else
 if (right[band]>=383) { lcd.write(3); } else
 if (right[band]>=255) { lcd.write(2); } else
 if (right[band]>=127) { lcd.write(1); } else
 if (right[band]>=0) { lcd.write(0); }
 }
}

If you’ve been reading through my tutorials there isn’t anything new to worry about. And now for the demo, with sound –

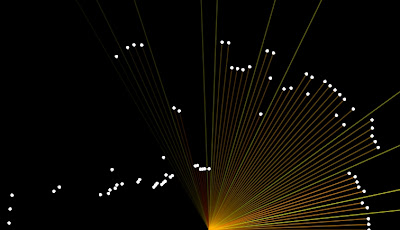
That would look great on the side of a Walkman, however it’s a bit small. Let’s scale it up by using a Freetronics Dot Matrix Display – you may recall these from Clock One. For some background knowledge check the review here.  Don’t forget to use a suitable power supply for the DMD – 5 V at 4 A will do nicely. The DMD contains 16 rows of 32 LEDs. This gives us twice the “resolution” to display each band level if desired. The display style is subjective, so for this example we’ll use a single column of LEDs for each frequency band, with a blank column between each one.

We use a lot of line-drawing statements to display the levels, and clear the DMD after each display. With this and the previous sketches, there could be room for efficiency – however I write these with the beginner in mind. Here’s the sketch:

// Example 48.3 - tronixstuff.com/tutorials > chapter 48 - 30 Jan 2013 
// MSGEQ7 spectrum analyser shield with a Freetronics DMD
// for DMD
#include "DMD.h" // for DMD
#include "SPI.h" // SPI.h must be included as DMD is written by SPI (the IDE complains otherwise)
#include "TimerOne.h"
#include "SystemFont5x7.h" // keep next two lines if you want to add some text
#include "Arial_black_16.h"
DMD dmd(1, 1); // creates instance of DMD to refer to in sketch
void ScanDMD() // necessary interrupt handler for refresh scanning of DMD
{ 
 dmd.scanDisplayBySPI();
}
int strobe = 4; // strobe pins on digital 4
int res = 5; // reset pins on digital 5
int left[7]; // store band values in these arrays
int right[7];
int band;
void setup()
{
 // for DMD
 //initialize TimerOne's interrupt/CPU usage used to scan and refresh the display
 Timer1.initialize( 5000 ); //period in microseconds to call ScanDMD. Anything longer than 5000 (5ms) and you can see flicker.
 Timer1.attachInterrupt( ScanDMD ); //attach the Timer1 interrupt to ScanDMD which goes to dmd.scanDisplayBySPI() 
 dmd.clearScreen( true ); //true is normal (all pixels off), false is negative (all pixels on)

 // for MSGEQ7
 pinMode(res, OUTPUT); // reset
 pinMode(strobe, OUTPUT); // strobe
 digitalWrite(res,LOW); // reset low
 digitalWrite(strobe,HIGH); //pin 5 is RESET on the shield
}
void readMSGEQ7()
// Function to read 7 band equalizers
{
 digitalWrite(res, HIGH);
 digitalWrite(res, LOW);
 for( band = 0; band < 7; band++ )
 {
 digitalWrite(strobe,LOW); // strobe pin on the shield - kicks the IC up to the next band 
 delayMicroseconds(30); // 
 left[band] = analogRead(0); // store left band reading
 right[band] = analogRead(1); // ... and the right
 digitalWrite(strobe,HIGH); 
 }
}
void loop()
{
 int xpos;
 readMSGEQ7();
 dmd.clearScreen( true ); 
 // display values of left channel on DMD
 for( band = 0; band < 7; band++ )
 {
 xpos = (band*2)+1;
 if (left[band]>=895) { dmd.drawLine( xpos, 15, xpos, 1, GRAPHICS_NORMAL ); } else
 if (left[band]>=767) { dmd.drawLine( xpos, 15, xpos, 3, GRAPHICS_NORMAL ); } else
 if (left[band]>=639) { dmd.drawLine( xpos, 15, xpos, 5, GRAPHICS_NORMAL ); } else
 if (left[band]>=511) { dmd.drawLine( xpos, 15, xpos, 7, GRAPHICS_NORMAL ); } else
 if (left[band]>=383) { dmd.drawLine( xpos, 15, xpos, 9, GRAPHICS_NORMAL ); } else
 if (left[band]>=255) { dmd.drawLine( xpos, 15, xpos, 11, GRAPHICS_NORMAL ); } else
 if (left[band]>=127) { dmd.drawLine( xpos, 15, xpos, 13, GRAPHICS_NORMAL ); } else
 if (left[band]>=0) { dmd.drawLine( xpos, 15, xpos, 15, GRAPHICS_NORMAL ); }
 }

 // display values of right channel on DMD
 for( band = 0; band < 7; band++ )
 {
 xpos = (band*2)+18;
 if (right[band]>=895) { dmd.drawLine( xpos, 15, xpos, 1, GRAPHICS_NORMAL ); } else
 if (right[band]>=767) { dmd.drawLine( xpos, 15, xpos, 3, GRAPHICS_NORMAL ); } else
 if (right[band]>=639) { dmd.drawLine( xpos, 15, xpos, 5, GRAPHICS_NORMAL ); } else
 if (right[band]>=511) { dmd.drawLine( xpos, 15, xpos, 7, GRAPHICS_NORMAL ); } else
 if (right[band]>=383) { dmd.drawLine( xpos, 15, xpos, 9, GRAPHICS_NORMAL ); } else
 if (right[band]>=255) { dmd.drawLine( xpos, 15, xpos, 11, GRAPHICS_NORMAL ); } else
 if (right[band]>=127) { dmd.drawLine( xpos, 15, xpos, 13, GRAPHICS_NORMAL ); } else
 if (right[band]>=0) { dmd.drawLine( xpos, 15, xpos, 15, GRAPHICS_NORMAL ); }
 }
}

… and here it is in action:

Conclusion

At this point you have the knowledge to use the MSGEQ7 ICs to create some interesting spectrum analysers for entertainment and visual appeal – now you just choose the type of display enjoy the results. And if you enjoyed this article, or want to introduce someone else to the interesting world of Arduino – check out my book (now in a fourth printing!) “Arduino Workshop”.

Have fun and keep checking into tronixstuff.com. Why not follow things on twitterGoogle+, subscribe  for email updates or RSS using the links on the right-hand column, or join our forum – dedicated to the projects and related items on this website.

The post Tutorial: Arduino and the MSGEQ7 Spectrum Analyzer appeared first on tronixstuff.

Bluetooth Tutorial 1


Introduction:
The bluetooth shield used in this project is a great way to detach the Arduino from your computer. What is even better, is that the shield allows you to control your arduino from your mobile phone or other bluetooth enabled device through simple Serial commands. In this tutorial we will connect a Grove Chainable RGB LED to the bluetooth shield directly, and send simple commands using the Bluetooth SPP app on a Samsung Galaxy S2 to change the colour of the LED (Red , Green and Blue)


Parts Required:
Freetronics Eleven or any compatible Arduino.
Bluetooth shield
Grove Chainable RGB LED
Grove Wire connectors


The Video:


The Arduino Sketch:


Arduino Code:
You can download the Arduino IDE from this site.


 1
2
3
4
5
6
7
8
9
10
11
12
13
14
15
16
17
18
19
20
21
22
23
24
25
26
27
28
29
30
31
32
33
34
35
36
37
38
39
40
41
42
43
44
45
46
47
48
49
50
51
52
53
54
55
56
57
58
59
60
61
62
63
64
65
66
67
68
69
70
71
72
73
74
75
76
77
78
79
80
81
82
83
84
85
86
87
88
89
90
91
92
93
94
95
96
97
98
99
100
101
102
103
104
105
106
107
108
109
110
111
112
113
114
115
116
117
118
119
120
121
122
123
124
125
126
127
128
129
130
131
132
133
134
135
136
137
138
139
140
141
142
143
144
145
146
147
148
149
150
151
152
153
154
155
156
157
158
159
/* This project combines the code from a few different sources.
This project was put together by ScottC on the 15/01/2013
http://arduinobasics.blogspot.com/

Bluetooth slave code by Steve Chang - downloaded from :
http://www.seeedstudio.com/wiki/index.php?title=Bluetooth_Shield

Grove Chainable RGB code can be found here :
http://www.seeedstudio.com/wiki/Grove_-_Chainable_RGB_LED#Introduction

*/

#include <SoftwareSerial.h> //Software Serial Port

#define uint8 unsigned char
#define uint16 unsigned int
#define uint32 unsigned long int

#define RxD 6 // This is the pin that the Bluetooth (BT_TX) will transmit to the Arduino (RxD)
#define TxD 7 // This is the pin that the Bluetooth (BT_RX) will receive from the Arduino (TxD)

#define DEBUG_ENABLED 1


int Clkpin = 9; //RGB LED Clock Pin (Digital 9)
int Datapin = 8; //RGB LED Data Pin (Digital 8)

SoftwareSerial blueToothSerial(RxD,TxD);

/*----------------------SETUP----------------------------*/
void setup() {
Serial.begin(9600); // Allow Serial communication via USB cable to computer (if required)
pinMode(RxD, INPUT); // Setup the Arduino to receive INPUT from the bluetooth shield on Digital Pin 6
pinMode(TxD, OUTPUT); // Setup the Arduino to send data (OUTPUT) to the bluetooth shield on Digital Pin 7
pinMode(13,OUTPUT); // Use onboard LED if required.
setupBlueToothConnection(); //Used to initialise the Bluetooth shield

pinMode(Datapin, OUTPUT); // Setup the RGB LED Data Pin
pinMode(Clkpin, OUTPUT); // Setup the RGB LED Clock pin

}

/*----------------------LOOP----------------------------*/
void loop() {
digitalWrite(13,LOW); //Turn off the onboard Arduino LED
char recvChar;
while(1){
if(blueToothSerial.available()){//check if there's any data sent from the remote bluetooth shield
recvChar = blueToothSerial.read();
Serial.print(recvChar); // Print the character received to the Serial Monitor (if required)

//If the character received = 'r' , then change the RGB led to display a RED colour
if(recvChar=='r'){
Send32Zero(); // begin
DataDealWithAndSend(255, 0, 0); // first node data
Send32Zero(); // send to update data
}

//If the character received = 'g' , then change the RGB led to display a GREEN colour
if(recvChar=='g'){
Send32Zero(); // begin
DataDealWithAndSend(0, 255, 0); // first node data
Send32Zero(); // send to update data
}

//If the character received = 'b' , then change the RGB led to display a BLUE colour
if(recvChar=='b'){
Send32Zero(); // begin
DataDealWithAndSend(0, 0, 255); // first node data
Send32Zero(); // send to update data
}
}

//You can use the following code to deal with any information coming from the Computer (serial monitor)
if(Serial.available()){
recvChar = Serial.read();

//This will send value obtained (recvChar) to the phone. The value will be displayed on the phone.
blueToothSerial.print(recvChar);
}
}
}


//The following code is necessary to setup the bluetooth shield ------copy and paste----------------
void setupBlueToothConnection()
{
blueToothSerial.begin(38400); //Set BluetoothBee BaudRate to default baud rate 38400
blueToothSerial.print("\r\n+STWMOD=0\r\n"); //set the bluetooth work in slave mode
blueToothSerial.print("\r\n+STNA=SeeedBTSlave\r\n"); //set the bluetooth name as "SeeedBTSlave"
blueToothSerial.print("\r\n+STOAUT=1\r\n"); // Permit Paired device to connect me
blueToothSerial.print("\r\n+STAUTO=0\r\n"); // Auto-connection should be forbidden here
delay(2000); // This delay is required.
blueToothSerial.print("\r\n+INQ=1\r\n"); //make the slave bluetooth inquirable
Serial.println("The slave bluetooth is inquirable!");
delay(2000); // This delay is required.
blueToothSerial.flush();
}


//The following code snippets are used update the colour of the RGB LED-----copy and paste------------
void ClkProduce(void){
digitalWrite(Clkpin, LOW);
delayMicroseconds(20);
digitalWrite(Clkpin, HIGH);
delayMicroseconds(20);
}

void Send32Zero(void){
unsigned char i;
for (i=0; i<32; i++){
digitalWrite(Datapin, LOW);
ClkProduce();
}
}

uint8 TakeAntiCode(uint8 dat){
uint8 tmp = 0;
if ((dat & 0x80) == 0){
tmp |= 0x02;
}

if ((dat & 0x40) == 0){
tmp |= 0x01;
}

return tmp;
}

// gray data
void DatSend(uint32 dx){
uint8 i;
for (i=0; i<32; i++){
if ((dx & 0x80000000) != 0){
digitalWrite(Datapin, HIGH);
} else {
digitalWrite(Datapin, LOW);
}

dx <<= 1;
ClkProduce();
}
}

// data processing
void DataDealWithAndSend(uint8 r, uint8 g, uint8 b){
uint32 dx = 0;

dx |= (uint32)0x03 << 30; // highest two bits 1,flag bits
dx |= (uint32)TakeAntiCode(b) << 28;
dx |= (uint32)TakeAntiCode(g) << 26;
dx |= (uint32)TakeAntiCode(r) << 24;

dx |= (uint32)b << 16;
dx |= (uint32)g << 8;
dx |= r;

DatSend(dx);
}

The code above was formatted using hilite.me

Notes:
You don't need to download a library to get this project running. But if you plan to use bluetooth shields to get 2 Arduinos to communicate to each other, then I would advise that you download the library files (which are just examples) from the Seeedstudio site : here.

Visit this site to setup your phone or laptop for bluetooth communication to the shield - here

The app used on my Samsung Galaxy S2 phone was "Bluetooth SPP"

You will initially need to enter a pin of '0000' to establish a connection to the Bluetooth shield - which will appear as "SeeedBTSlave" or whatever text you place on line 90 of the Arduino code above.


Warning !

Not all phones are compatible with the bluetooth shield.
If you have used this shield before - please let me know what phone you used - so that we can build a list and inform others whether their phone is likely to work with this project or not. Obviously - those phones that do not have bluetooth within - will not work :).
And I have not tried any other apps either

I got it to work very easily with my Samsung Galaxy S2 using the free Bluetooth SPP app from the google play store.

This was fun, but I want to make my own app !
Have a look at my latest 4-part tutorial which takes you step-by-step through the process of building your own app using the Processing/Android IDE.
You can build your own GUI interface on your Android Phone and get it to communicate via Bluetooth to your Arduino/Bluetooth Shield. Click on the links below for more information:


If you like this page, please do me a favour and show your appreciation :

 
Visit my ArduinoBasics Google + page.
Follow me on Twitter by looking for ScottC @ArduinoBasics.
Have a look at my videos on my YouTube channel.


However, if you do not have a google profile...
Feel free to share this page with your friends in any way you see fit.

Sonar Project Tutorial


Introduction:
This project utilises the HC-SR04 ultrasonic sensor to scan for nearby objects. You can program the Arduino to sound an alarm when the sensor detects an object within a specific vicinity. Connecting it to a computer allows data to be plotted to make a simple sonar scanner. The scanning ability is made possible through the use of a hobby servo motor SG-5010, and an Adafruit motor shield v1.0.
This project could easily be extended to provide object avoidance for any robotics project. This tutorial was designed so that you could see how the components interact, and also to see how you can use and expand the functionality of the motor shield.


Parts Required:
Freetronics Eleven or any compatible Arduino.
Adafruit motor shield v1.0
HC-SR04 Ultrasonic Sensor
MG-995  or SG-5010 Standard servo
Mini Breadboard 4.5cm x 3.5cm
Female header pins to allow easy access to the analog pins on the Motor Shield
Piezo buzzer - to sound alarm
9V Battery and Battery Clip
Wiresto connect it all together

Gauge parts:

Paper (to print the face of the gauge), and some glue to stick it to the wood.
MDF Standard panel (3mm width) - for the top and base of the gauge, and the pointer.
Galvanized bracket (25x25x40mm)
Timber screws: Hinge-long threads csk head Phillips drive (4G x 12mm)
Velcro dots - to allow temporary application of the mini-breadboard to the gauge.

The gauge was used as a customisable housing for the Arduino and related parts, and to provide some visual feedback of the servo position.


The Video:


The Arduino Sketch:


 Part of the sketch above was created using Fritzing.

The Servo motor can be connected to either of the Servo motor pins (Digital 9 or 10). In this case, the Servo is attached to digital pin 10.Make sure you read the servo motor data sheet and identify the VCC (5V), GND, and Signal connectors. Not all servos have the same colour wires. My servo motor has a white signal wire, a red VCC wire and a black GND wire.

Also when connecting your wires to the HC-SR04, pay attention to the front of the sensor. It will identify the pins for you. Make sure you have the sensor facing the correct way. In this sketch, the sensor is actually facing towards you.

In this sketch - we connect the
    Echo pin to Analog pin 0 (A0).
    Trigger pin to Analog pin 1 (A1)
    VCC to a 5V line/pin 
    and GND to a GND line/pin

Pay attention to your motor shield, I have seen some pictures on the internet where the 5V and GND are reversed.


Arduino Code:
You can download the Arduino IDE from this site.

The motor shield requires the Adafruit motor shield driver library to be installed into the Arduino IDE.

 1
2
3
4
5
6
7
8
9
10
11
12
13
14
15
16
17
18
19
20
21
22
23
24
25
26
27
28
29
30
31
32
33
34
35
36
37
38
39
40
41
42
43
44
45
46
47
48
49
50
51
52
53
54
55
56
57
58
59
60
61
62
63
64
65
66
67
68
69
70
71
72
73
74
75
76
77
78
79
80
81
82
83
84
85
86
87
88
89
90
91
92
93
94
95
96
97
98
99
100
101
102
103
104
/* ArduinoBasics: Sonar Project - Created by Scott C on 10 Jan 2013
http://arduinobasics.blogspot.com/2013/01/arduino-basics-sonar-project-tutorial.html

This project uses the Adafruit Motor shield library (copyright Adafruit Industries LLC, 2009
this code is public domain, enjoy!)

The HC-SR04 sensor uses some code from the following sources:
From Virtualmix: http://goo.gl/kJ8Gl
Modified by Winkle ink here: http://winkleink.blogspot.com.au/2012/05/arduino-hc-sr04-ultrasonic-distance.html
And modified further by ScottC here: http://arduinobasics.blogspot.com/
on 10 Nov 2012.
*/

#include <AFMotor.h>
#include <Servo.h>

// DC hobby servo
Servo servo1;

/* The servo minimum and maximum angle rotation */
static const int minAngle = 0;
static const int maxAngle = 176;
int servoAngle;
int servoPos;
int servoPin = 10;


/* Define pins for HC-SR04 ultrasonic sensor */
#define echoPin A0 // Echo Pin = Analog Pin 0
#define trigPin A1 // Trigger Pin = Analog Pin 1
#define LEDPin 13 // Onboard LED
long duration; // Duration used to calculate distance
long HR_dist=0; // Calculated Distance
int HR_angle=0; // The angle in which the servo/sensor is pointing
int HR_dir=1; // Used to change the direction of the servo/sensor
int minimumRange=5; //Minimum Sonar range
int maximumRange=200; //Maximum Sonar Range

/*--------------------SETUP()------------------------*/
void setup() {
//Begin Serial communication using a 9600 baud rate
Serial.begin (9600);

// Tell the arduino that the servo is attached to Digital pin 10.
servo1.attach(servoPin);

//Setup the trigger and Echo pins of the HC-SR04 sensor
pinMode(trigPin, OUTPUT);
pinMode(echoPin, INPUT);
pinMode(LEDPin, OUTPUT); // Use LED indicator (if required)
}

/*----------------------LOOP()--------------------------*/
void loop() {

/* check if data has been sent from the computer: */
if (Serial.available()) {

/* This expects an integer from the Serial buffer */
HR_angle = Serial.parseInt();

/* If the angle provided is 0 or greater, then move servo to that
position/angle and then get a reading from the ultrasonic sensor */
if(HR_angle>-1){
/*Make sure that the angle provided does not go beyond the capabilities
of the Servo. This can also be used to calibrate the servo angle */
servoPos = constrain(map(HR_angle, 0,180,minAngle,maxAngle),minAngle,maxAngle);
servo1.write(servoPos);

/* Call the getDistance function to take a reading from the Ultrasonic sensor */
getDistance();
}
}
}

/*--------------------getDistance() FUNCTION ---------------*/
void getDistance(){

/* The following trigPin/echoPin cycle is used to determine the
distance of the nearest object by bouncing soundwaves off of it. */
digitalWrite(trigPin, LOW);
delayMicroseconds(2);

digitalWrite(trigPin, HIGH);
delayMicroseconds(10);

digitalWrite(trigPin, LOW);
duration = pulseIn(echoPin, HIGH);

//Calculate the distance (in cm) based on the speed of sound.
HR_dist = duration/58.2;

/*Send the reading from the ultrasonic sensor to the computer */
if (HR_dist >= maximumRange || HR_dist <= minimumRange){
/* Send a 0 to computer and Turn LED ON to indicate "out of range" */
Serial.println("0");
digitalWrite(LEDPin, HIGH);
} else {
/* Send the distance to the computer using Serial protocol, and
turn LED OFF to indicate successful reading. */
Serial.println(HR_dist);
digitalWrite(LEDPin, LOW);
}
}

The code above was formatted using hilite.me

Notes:
Servo Angles: You will notice on line 22, the maximum servo angle used was 176. This value was obtained through trial and error (see below).

Calibrating the servo angles
You may need to calibrate your servo in order to move through an angle of 0 to 180 degrees without straining the motor. Go to line 21-22 and change the minAngle to 0 and the maxAngle to 180. Once you load the sketch to the Arduino/Freetronics ELEVEN, you can then open the Serial Monitor and type a value like 10 <enter>, and then keep reducing it until you get to 0. If you hear the servo motor straining, then move it back up to a safe value and change the minimum servo angle to that value. Do the same for the maximum value.

In this example, the servo's minAngle value was 0, and maxAngle value was 176 after calibration, however, as you can see from the video, the physical range of the servo turned out to be 0 to 180 degrees.


The Processing Sketch

You can download the Processing IDE from this site.

 1
2
3
4
5
6
7
8
9
10
11
12
13
14
15
16
17
18
19
20
21
22
23
24
25
26
27
28
29
30
31
32
33
34
35
36
37
38
39
40
41
42
43
44
45
46
47
48
49
50
51
52
53
54
55
56
57
58
59
60
61
62
63
64
65
66
67
68
69
70
71
72
73
74
75
76
77
78
79
80
81
82
83
84
85
86
87
88
89
90
91
92
93
94
95
96
97
98
99
100
101
102
103
104
105
106
107
108
109
110
/* Created by ScottC on 10 Jan 2013 
http://arduinobasics.blogspot.com/2013/01/arduino-basics-sonar-project-tutorial.html
*/

import processing.serial.*;

int distance;
int angle=0;
int direction=1;

int[] alphaVal = new int[100]; // used to fade the lines
int[] distance2 = new int[100]; // used to store the line lengths
int lineSize = 4; // line length multiplier (makes it longer)

String comPortString;
Serial comPort;

/*---------------------SETUP---------------------------*/
void setup( ) {
size(displayWidth,displayHeight); //allows fullscreen view
smooth();
background(0); // set the background to black

/*Open the serial port for communication with the Arduino
Make sure the COM port is correct - I am using COM port 8 */
comPort = new Serial(this, "COM8", 9600);
comPort.bufferUntil('\n'); // Trigger a SerialEvent on new line

/*Initialise the line alphaValues to 0 (ie not visible) */
for(int i=0; i<91; i++){
alphaVal[i] = 0;
}
}

/*---------------------DRAW-----------------*/
void draw( ) {
background(0); //clear the screen

/*Draw each line and dot */
for(int i=0; i<91; i++){

/*Gradually fade each line */
alphaVal[i]=alphaVal[i]-4;

/*Once it gets to 0, keep it there */
if(alphaVal[i]<0){
alphaVal[i]=0;
}

/*The colour of the line will change depending on the distance */
stroke(255,distance2[i],0,alphaVal[i]);

/* Use a line thickness of 2 (strokeweight) to draw the line that fans
out from the bottom center of the screen. */
strokeWeight(2);
line(width/2, height, (width/2)-cos(radians(i*2))*(distance2[i]*lineSize), height-sin(radians(i*2))*(distance2[i]*lineSize));

/* Draw the white dot at the end of the line which does not fade */
stroke(255);
strokeWeight(1);
ellipse((width/2)-cos(radians(i*2))*(distance2[i]*lineSize), height-sin(radians(i*2))*(distance2[i]*lineSize),5,5);
}
}

/* A mouse press starts the scan. There is no stop button */
void mousePressed(){
sendAngle();
}

/*When the computer receives a value from the Arduino, it will update the line positions */
void serialEvent(Serial cPort){
comPortString = cPort.readStringUntil('\n');
if(comPortString != null) {
comPortString=trim(comPortString);

/* Use the distance received by the Arduino to modify the lines */
distance = int(map(Integer.parseInt(comPortString),1,200,1,height));
drawSonar(angle,distance);

/* Send the next angle to be measured by the Arduino */
sendAngle();
}
}

/*---------------------------sendAngle() FUNCTION----------------*/
void sendAngle(){
//Send the angle to the Arduino. The fullstop at the end is necessary.
comPort.write(angle+".");

/*Increment the angle for the next time round. Making sure that the angle sent
does not exceed the servo limits. The "direction" variable allows the servo
to have a sweeping action.*/
angle=angle+(2*direction);
if(angle>178||angle<1){
direction=direction*-1;
}
}

/*-----------------sketchFullScreen(): Allows for FullScreen view------*/
boolean sketchFullScreen() {
return true;
}

/*----------------- drawSonar(): update the line/dot positions---------*/
void drawSonar(int sonAngle, int newDist){
alphaVal[sonAngle/2] = 180;
distance2[sonAngle/2] = newDist;
}


The Processing Output


Analog IR Temperature gauge


Introduction:
The IRTEMP module from Freetronics is an infrared remote temperature sensor that can be incorporated into your Arduino / microcontroller projects. It can scan a temperature between -33 to +220 C, and can be operated using a 3.3 to 5V power supply. It can be powered directly from the Arduino 5V pin.  This module can also provide an ambient temperature reading if required.
The Servo used in this project is a SG-5010 standard servo which will be utilised to display the temperature reading from the IRTEMP module.


Parts Required:
Freetronics Eleven or any compatible Arduino.
Freetronics IRTEMP module
MG-995  or SG-5010 Standard servo
Mini Breadboard 4.5cm x 3.5cm
Protoshieldand female header pins (not essential - but makes it more tidy)
9V Battery and Battery Clip
Wiresto connect it all together

Gauge parts:
Paper (to print the face of the gauge), and some glue to stick it to the wood.
MDF Standard panel (3mm width) - for the top and base of the gauge.
Galvanized bracket (25x25x40mm)
Timber screws: Hinge-long threads csk head Phillips drive (4G x 12mm)


The Video:


The Arduino Sketch:


     The above sketch was created using Fritzing.


Arduino Code:
You can download the Arduino IDE from this site.

The IRTemp gauge requires a driver library to be installed into the Arduino IDE.
The latest IRTemp driver library can be found here.

 1
2
3
4
5
6
7
8
9
10
11
12
13
14
15
16
17
18
19
20
21
22
23
24
25
26
27
28
29
30
31
32
33
34
35
36
37
38
39
40
41
42
43
44
45
46
47
48
49
50
51
52
53
54
55
56
57
58
59
60
61
62
63
64
65
66
67
68
69
70
71
72
73
74
75
76
77
78
79
80
81
82
83
84
/* -------------------------------------------------------
Analog IR Temperature Gauge: written by ScottC on 1st Dec 2012.
http://arduinobasics.blogspot.com/2012/12/arduino-basics-analog-ir-temperature.html


* Some of the code was adapted from a sketch by Andy Gelme (@geekscape)
* For more information on using the IRTEMP
see www.freetronics.com/irtemp

* IRTemp library uses an Arduino interrupt:
* If PIN_CLOCK = 2, then Arduino interrupt 0 is used
* If PIN_CLOCK = 3, then Arduino interrupt 1 is used
---------------------------------------------------------*/

#include "IRTemp.h"
#include <Servo.h>

Servo servo1;
static const byte PIN_DATA = 2;
static const byte PIN_CLOCK = 3; // Must be either pin 2 or pin 3
static const byte PIN_ACQUIRE = 4;

static const bool SCALE=false; // Celcius: false, Farenheit: true

/* Used to capture the temperature from the IRTEMP sensor */
float irTemperature;
int temp;

/* The minimum and maximum temperatures on the gauge. */
static const int minTemp = -45;
static const int maxTemp = 135;


/* The servo minimum and maximum angle rotation */
static const int minAngle = 0;
static const int maxAngle = 175;
int servoPos;

IRTemp irTemp(PIN_ACQUIRE, PIN_CLOCK, PIN_DATA);


/*----------------------SETUP----------------------*/

void setup(void) {

servo1.attach(9); // turn on servo
}


/*-----------------------LOOP-----------------------*/

void loop(void) {
irTemperature = irTemp.getIRTemperature(SCALE);
printTemperature("IR", irTemperature);

/* If you want the ambient temperature instead - then use the code below. */
//float ambientTemperature = irTemp.getAmbientTemperature(SCALE);
//printTemperature("Ambient", ambientTemperature);

}

/*-----------printTemperature function---------------*/

void printTemperature(char *type, float temperature) {

temp=(int) temperature;
servoPos = constrain(map(temp, minTemp,maxTemp,minAngle,maxAngle),minAngle,maxAngle);

if (isnan(temperature)) {
//is not a number, do nothing
}
else {

/* To test the minimum angle insert the code below */
//servoPos = minAngle;

/*To test the maximum angle, insert the code below */
//servoPos = maxAngle;

/* Rotate servo to the designated position */
servo1.write(servoPos);
}
}

The code above was formatted using hilite.me

Notes:
Ambient temperature: If you want to get the ambient temperature from the IRTEMP module, then have a look at lines 58-59.
Servo Angles: You will notice on line 36, the maximum servo angle used was 175. This value was obtained through trial and error (see below).

Calibrating the servo angles
You may need to calibrate your servo in order to move through an angle of 0 to 180 degrees without straining the motor.Change the minAngle on line 35to a safe value (for example: 10), and the maxAngle on line 36 to a value like 170. Remove the comment tag (//) on line 76, and then run the sketch. Lower the minAngle until it reaches the minimum value on the gauge, making sure that the servo doesn't sound like it is straining to keep it in position.

Add the comment tag (//) back in, and then take out the comment tag for line 79. And follow a similar process, until you reach the maximum value on the gauge. Once again, make sure that the servo is not making a straining noise to hold it at that value. Make sure to add the comment tag back in, when you have finished the calibration.

In this example, the servo's minAngle value was 0, and maxAngle value was 175 after calibration, however, as you can see from the video, the physical range of the servo turned out to be 0 to 180 degrees.


The Temperature Gauge Picture

The following gauge was created in Microsoft Excel using an X-Y chart.  Data labels were manually repositioned in order to get the desired numerical effect.