

Better I-V plot for Schottky diodes
Yesterday I posted a voltage-versus-current curve for a 1N5817 Schottky diode, to confirm the theoretical formula 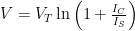

The voltage does fit nicely to the log of current, with IS=1.32µA and VT=27.1 mV. Given the quantization noise in the voltage measurement, these seem like a pretty good fit to theory. (click to embiggen)
One problem is that the serial variable resistor I used did not all really low currents. I rewired it today so that I had a potentiometer providing the voltage, rather than a series variable resistor:

I also wrote a little Python program to merge different data files, so that I could combine files in which the resistance of R2 (for measuring the current) differed.
The resulting data fits the model well for over six decades (> 120dB):
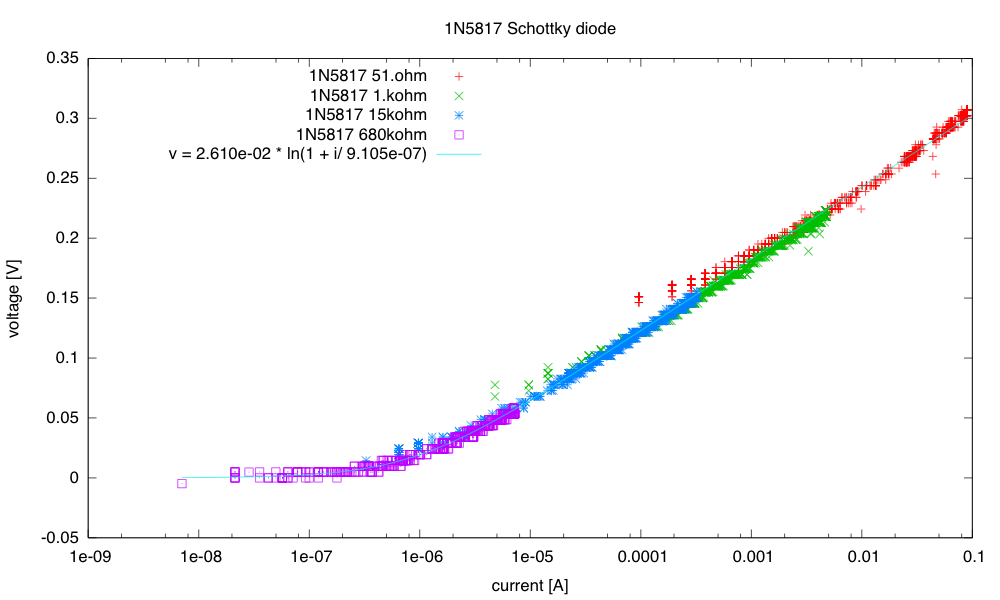
Fitting over a wide range of currents is more robust than fitting over the narrower range that I can get with just one value for R2.
There is quantization error still on the voltages, but the overlapping current ranges give good data for most of the range. VT is now 26.1mV and IS is 0.91µA.
The measurements at the high-current end had to be redone with an external power supply for the Leonardo Arduino board (not just USB power), as the reference voltage for the A-to-D converter dipped as the load increased. There is a tiny effect still when using an external power supply, but only at the very highest current level, and it is buried in the noise.
At the low-current end, we can see the flattening of the curve from the “1+” term that is often omitted from the model. The resolution in the voltage is poor there, but the current knee can be fairly accurately set by using a large value for R2.
I should probably characterize the base-emitter junction of a PNP and an NPN transistor this way also, for setting the appropriate resistances for the log amplifier in the loudness circuit.
Filed under: Circuits course, Data acquisition Tagged: Arduino, i-vs-v-plot, Schottky diode


[original story: Gas station without pumps]
 , where IS is the saturation current of the diode, but I wasn’t really satisfied with the results, either in terms of dynamic range or the quality of the fit.


